Ethnic groups in Latin America


The inhabitants of Latin America are from a variety of ancestries, ethnic groups and races, making the region one of the most diverse in the world.[1] The specific composition of the group varies from country to country. Many have a predominance of European-Amerindian or Mestizo population; in others, Amerindians are a majority; some are dominated by inhabitants of European ancestry; and some countries' populations have large African or Mulatto populations.
Overview
According to Jon Aske:
Before Hispanics became such a 'noticeable' group in the U.S., the distinction between black and white was the major racial division and according to the one-drop rule adhered to by the culture at large, one drop of African ancestry usually meant that the person was Black. ...
The notion of racial continuum and a separation of race (or skin color) and ethnicity, on the other hand, is the norm in most of Latin America. In the Spanish and Portuguese empires, racial mixing or miscegenation was the norm and something that the Spanish and Portuguese had grown rather accustomed to during the hundreds of years of contact with Arabs and North Africans in the Iberian peninsula. But, demographics may have made this inevitable as well. Thus, for example, of the approximately 13.5 million people who lived in the Spanish colonies in 1800 before independence only about one fifth were white. This contrasts with the U.S., where more than four fifths were whites (out of a population of 5.3 million in 1801, 900,000 were slaves, plus approximately 60,000 free blacks). ...
The fact of the recognition of a racial continuum in Hispanic American (sic) does not mean that there wasn't discrimination, which there was, or that there wasn't an obsession with race, or 'castes', as they were sometimes called. ...
In areas with large indigenous Amerindian populations, a racial mixture resulted, which is known in Spanish as mestizos ... who are a majority in Mexico, Central America and most of South America. Similarly, when African slaves were brought to the Caribbean region and Brazil, where there was very little indigenous presence left, unions between them and Spanish produced a population of mixed mulatos ... who are a majority of the population in many of those Spanish-speaking Caribbean basin countries (Cuba, Dominican Republic, Puerto Rico, Colombia, and Venezuela).
Aske has also written that:
Spanish colonization was rather different from later English, or British, colonization of North America. They had different systems of colonization and different methods of subjugation. While the English were primarily interested in grabbing land, the Spanish in addition had a mandate to incorporate the land's inhabitants into their society, something which was achieved by religious conversion and sexual unions which produced a new 'race' of mestizos, a mixture of Europeans and indigenous peoples. mestizos (sic) form the majority of the population in Mexico, Central America, and much of South America. Racial mixing or miscegenation, after all, was something that the Spanish and Portuguese had been accustomed to during the hundreds of years of contact with Arabs and North Africans.
Similarly, later on, when African slaves were introduced into the Caribbean basin region, unions between them and Spaniards produced a population of mulatos, who are a majority of the population in the Caribbean islands (the Antilles) (Cuba, Dominican Republic, Puerto Rico), as well as other areas of the Caribbean region (Colombia, Venezuela and parts of the Central American Caribbean coast). mestizos (sic) and mulatos may not have always have been first class citizens in their countries, but they were never disowned in the way the outcomes of unions of Europeans and Native Americans were in the British colonies, where interracial marriages were taboo and one drop of Black or Amerindian blood was enough to make the person 'impure'.
In his famous 1963 book The Rise of the West, William Hardy McNeill wrote that:
Racially mixed societies arose in most of Spanish and Portuguese America, compounded in varying proportions from European, Indian, and Negro strands. Fairly frequent resort to manumission mitigated the hardships of slavery in those areas; and the Catholic church positively encouraged marriages between white immigrants and Indian women as a remedy for sexual immorality. However, in the southern English colonies and in most of the Caribbean islands, the importation of Negro slaves created a much more sharply polarized biracial society. Strong race feeling and the servile status of nearly all Negroes interdicted intermarriage, practically if not legally. Such discrimination did not prevent interbreeding; but children of mixed parentage were assigned to the status of their mothers. Mulattoes and Indian half-breeds were thereby excluded from the white community. In Spanish (and, with some differences, Portuguese) territories a more elaborate and less oppressive principle of racial discrimination established itself. The handful of persons who had been born in the homelands claimed topmost social prestige; next came those of purely European descent; while beneath ranged the various racial blends to form a social pyramid whose numerous racial distinctions meant that no one barrier could become as ugly and inpenetrable as that dividing whites from Negroes in the English, Dutch, and French colonies.
Thomas C. Wright, meanwhile, has written that:
The demographic makeup of colonial Latin America became more complex when, as the native population declined, the Portuguese, Spanish, and the French in Haiti turned to Africa for labor, as did the British in North America. The tricontinental heritage that characterizes Latin America, then, is shared by the United States, but even a casual examination reveals that the outcome of the complex interaction of different peoples has varied. While miscegenation among the three races certainly occurred in North America, it appears to have been much less common than in Latin America. Furthermore, offspring of such liaisons were not recognized as belonging to new, distinct racial categories in North America as they were in Latin America. The terms mestizo or mameluco, mulatto, the general term castas, and dozens of subcategories of racial identity frankly recognized the outcomes of interracial sexual activity in Latin America and established a continuum of race rather than the unrealistic absolute categories of white, black, or Indian as used in the United States. (The U.S. Census Bureau's forms did not allow individuals to list more than one race until 2000.)
Ethnic groups
- Amerindians. The indigenous population of Latin America, the Amerindians, arrived during the Lithic stage. In post-Columbian times they experienced tremendous population decrease, particularly in the early decades of colonization. They have since recovered in numbers, surpassing sixty million by some estimates.[6] With the growth of other groups, they now compose a majority only in Bolivia. In Guatemala, Amerindians are a large minority who comprise two-fifths of the population. Mexico's 14%[7] (9.8% in the official 2005 census) is the next largest population, and one of the largest Amerindian populations in the Americas in absolute numbers. Most of the remaining countries have Amerindian minorities, in every case making up less than one-tenth of the respective country's population. In many countries, people of mixed Amerindian and European ancestry make up the majority of the population (see Mestizo).
- Asians. People of Asian descent number several million in Latin America. The first Asians to settle in the region were Filipino, as a result of Spain trading in Asia and the Americas. The majority of Asian Latin Americans are of Japanese or Chinese ancestry and reside mainly in Brazil and Peru; there is also a growing Chinese minority in Panama. Brazil is home to about two million people of Asian descent; this includes the largest ethnic Japanese community outside Japan itself (estimated as high as 1.5 million), and about 200,000 ethnic Chinese and 100,000 ethnic Koreans.[8][9] Ethnic Koreans also number tens of thousands in Argentina and Mexico.[10] Peru, with 1.47 million people of Asian descent,[11][12] has one of the largest Chinese communities in the world, with nearly one million Peruvians being of Chinese ancestry. There is a strong ethnic-Japanese presence in Peru, where a past president and a number of politicians are of Japanese descent. The Martinican population includes an African-White-Indian mixed population, and an East Indian (Asian Indian) population.[13] The Guadeloupe East Indian population is estimated at 14% of the population.
- Blacks. Millions of Africans were brought to Latin America from the 16th century onward, the majority of whom were sent to the Caribbean region and Brazil. Today, people identified as "Black" are most numerous in Brazil (more than 10 million) and in Haiti (more than 7 million).[14] Among the Hispanic nations, Brazil leads this category in relative numbers with 7% of the population being Afro-Latin American. Significant populations are also found in Puerto Rico, Cuba, Dominican Republic, Ecuador, Peru, Honduras, Nicaragua, Costa Rica, Panama, Colombia, Venezuela and Uruguay. Latin Americans of mixed Black and White ancestry, called Mulattoes, are far more numerous than Blacks.
- Mestizos. Intermixing between Europeans and Amerindians began early in the colonial period and was extensive. The resulting people, known as Mestizos, make up the majority of the population in half of the countries of Latin America. Additionally, Mestizos compose large minorities in nearly all the other mainland countries.
- Mulattoes. Mulattoes are people of mixed European and African ancestry. In Latin America, Mulattoes descend primarily from Spanish or Portuguese settlers on one side, and African on the other. Brazil is home to Latin America's largest mulatto population. Mulattoes are a population majority in the Dominican Republic and, depending on the source, Cuba as well. Mulattoes are also numerous in Panama, Honduras, Costa Rica, Colombia, Puerto Rico, Ecuador, Peru, Venezuela and Uruguay. Smaller populations of mulattoes are found in other Latin American countries.[6]
- Whites. Beginning in the late 15th century, large numbers of Iberian colonists settled in what became Latin America. The Portuguese colonized Brazil primarily, and the Spaniards settled elsewhere in the region. At present, most White Latin Americans are of Spanish or Portuguese origin. Iberians brought the Spanish and Portuguese languages, the Catholic faith, and many Iberian-Latin traditions. Brazil, Argentina, Mexico, Colombia and Venezuela contain the largest absolute numbers of Whites in Latin America.[7] Whites make up the majorities of Argentina, Costa Rica, Puerto Rico, Chile, Uruguay, and depending on the source in Cuba. Whites make up nearly half of Brazil's population.[7][15][16] Ever since most of Latin America gained independence in the 1810s–1820s, millions of people have immigrated there. Of these immigrants, Italians formed the largest group, and next were Spaniards and Portuguese.[17] Many others arrived, such as French, Germans, Greeks, Poles, Ukrainians, Russians, Estonians, Latvians, Lithuanians, Irish, and Welsh. Also included are Jews, as well as Arabs of Lebanese, Syrian, and Palestinian descent; most of them are Christian.[18] Whites presently compose the largest racial group in Latin America (36% in the table herein) and, whether as White, Mestizo, or Mulatto, the vast majority of Latin Americans have white ancestry.[19]
- Zambos: Intermixing between Africans and Amerindians was especially prevalent in Colombia, Nicaragua, Venezuela, and Brazil, often due to slaves running away (becoming cimarrones: maroons) and being taken in by Amerindian villagers. In Spanish speaking nations, people of this mixed ancestry are known as Zambos[20] in Middle America, and Cafuzos in Brazil.
In addition to the foregoing groups, Latin America also has millions of tri-racial peoples of African, Amerindian, and European ancestry. Most are found in the Dominican Republic, Colombia, Costa Rica, Panama, Venezuela, Puerto Rico, Brazil, and Peru with a much smaller presence in other countries.
According to Lizcano
The following table contains information based on a 2014 non-genetic work entitled "Composición Étnica de las Tres Áreas Culturales del Continente Americano al Comienzo del Siglo XXI" ("Ethnic Composition of the Three Cultural Areas of the American Continent at the Beginning of the 21st Century") by National Autonomous University of Mexico professor Francisco Lizcano Fernández.
Fernández compiled his estimation of groups based on criteria of cultural patterns, not on genotypes nor even phenotype.[7] In these estimations, therefore, "whites" encompasses all those whose practiced culture is predominantly Iberian-derived, while "mestizos" encompasses those whose practiced culture noticeably mixes Iberian and Amerindian cultural traditions, and "Amerindians" only those whose practiced culture is predominantly indigenous.
The resulting effect of employing these criteria, therefore, skews the figure of said groups if they had been based on genetic factors, or even based on phenotypic factors. Thus, for instance, the estimate of "whites" given for Chile would include mostly genetic mestizos, while the estimate of "mestizos" in Mexico would include not only a significant proportion of genetic Amerindians, but also many genetic whites, and so on for other countries.
| Country | Population 2014[21] |
Whites | Mestizos | Mulattoes | Amerindians | Blacks | Asians | Creoles & Garifunas |
|---|---|---|---|---|---|---|---|---|
| 41,769,726 | 85.0% | 11.1% | 0.0% | 1.0% | 0.0% | 2.9% | 0.0% | |
| 10,118,683 | 15.0% | 28.0% | 2.0% | 55.0% | 0.0% | 0.0% | 0.0% | |
| 203,429,773 | 53.8% | 0.0% | 39.1% | 0.4% | 6.2% | 0.5% | 0.0% | |
| 16,888,760 | 52.7% | 39.3% | 0.0% | 8.0% | 0.0% | 0.0% | 0.0% | |
| 44,725,543 | 20.0% | 58.2% | 10.0% | 1.8% | 3.9% | 0.0% | 0.1% | |
| 4,576,562 | 82.0% | 15.0% | 0.0% | 0.8% | 0.0% | 0.2% | 2.0% | |
| 11,087,330 | 64.2% | 0.0% | 26.6% | 0.0% | 9.3% | 1.0% | 0.0% | |
| 9,956,648 | 14.6% | 0.0% | 75.0% | 0.0% | 7.7% | 0.4% | 2.3% | |
| 15,007,343 | 9.9% | 42.0% | 5.0% | 39.0% | 5.0% | 0.1% | 0.0% | |
| 6,071,774 | 1.0% | 91.0% | 0.0% | 8.0% | 0.0% | 0.0% | 0.0% | |
| 13,824,463 | 4.0% | 42.0% | 0.0% | 53.0% | 0.0% | 0.8% | 0.2% | |
| 8,143,564 | 1.0% | 85.6% | 1.7% | 7.7% | 0.0% | 0.7% | 3.3% | |
| 121,724,226 | 15.0% | 70.0% | 0.5% | 14.0% | 0.0% | 0.5% | 0.0% | |
| 5,666,301 | 14.0% | 78.3% | 0.0% | 6.9% | 0.0% | 0.2% | 0.6% | |
| 3,460,462 | 10.0% | 32.0% | 27.0% | 8.0% | 5.0% | 4.0% | 14.0% | |
| 6,759,058 | 20.0% | 74.5% | 3.5% | 1.5% | 0.0% | 0.5% | 0.0% | |
| 30,814,175 | 12.0% | 32.0% | 9.7% | 45.5% | 0.0% | 0.8% | 0.0% | |
| 3,989,133 | 74.8% | 0.0% | 10.0% | 0.0% | 15.0% | 0.2% | 0.0% | |
| 3,308,535 | 88.0% | 8.0% | 4.0% | 0.0% | 0.0% | 0.0% | 0.0% | |
| 27,635,743 | 16.9% | 37.7% | 37.7% | 2.7% | 2.8% | 2.2% | 0.0% | |
| Total | 579,092,570 | 36.1% | 30.3% | 20.3% | 9.2% | 3.2% | 0.7% | 0.2% |
Note: "Creoles" refer to people of African descent who emigrated from British and French colonies in the Caribbean to Central America.[7]
According to Latinobarometro
The following table shows how Latin Americans answer the question What race do you consider yourself belonging to? in the Latinobarometro survey.[22]
| Country | Mestizos | Whites | Amerindians | Mulattoes | Blacks | Asians | Other race | DK/NA |
|---|---|---|---|---|---|---|---|---|
| 26% | 61% | 1% | 1% | 1% | 0% | 3% | 7% | |
| 57% | 4% | 27% | 1% | 1% | 0% | 1% | 9% | |
| 27% | 41% | 1% | 13% | 17% | 0% | 1% | 0% | |
| 59% | 30% | 8% | 1% | 0% | 0% | 2% | 0% | |
| 47% | 26% | 5% | 5% | 6% | 0% | 2% | 9% | |
| 31% | 40% | 4% | 17% | 3% | 1% | 1% | 3% | |
| 29% | 11% | 4% | 24% | 26% | 3% | 0% | 3% | |
| 81% | 4% | 7% | 3% | 3% | 1% | 0% | 1% | |
| 68% | 10% | 5% | 4% | 4% | 2% | 0% | 7% | |
| 32% | 17% | 45% | 1% | 1% | 0% | 1% | 3% | |
| 67% | 1% | 13% | 16% | 2% | 1% | 1% | 0% | |
| 52% | 6% | 19% | 2% | 0% | 1% | 3% | 17% | |
| 67% | 6% | 8% | 2% | 3% | 1% | 0% | 13% | |
| 53% | 16% | 7% | 5% | 10% | 1% | 1% | 7% | |
| 81% | 3% | 3% | 1% | 1% | 0% | 2% | 9% | |
| 76% | 6% | 7% | 1% | 1% | 1% | 1% | 7% | |
| 7% | 74% | 1% | 4% | 3% | 0% | 3% | 8% | |
| 33% | 32% | 4% | 21% | 8% | 0% | 0% | 2% | |
| Total | 47% | 24% | 9% | 6% | 5% | 1% | 1% | 7% |
According to other sources
This is a list of ethnic groups based on national or other sources.
| Country | Amerindian | White | Mestizo | Mulatto | Black | Asian | Pardo or Mixed | Garifuna or Zambo | Other | Undeclared | Type of study | Year |
|---|---|---|---|---|---|---|---|---|---|---|---|---|
| 5.0% | 85.0% | 10.0% | 0.0% | 0.0% | 0.0% | 0.0% | 0.0% | 0.0% | 0.0% | Census | 2010 | |
| 37.0% | 3.0% | 52.0% | 0.0% | 1.0% | 0.0% | 0.0% | 0.0% | 0.0% | 7.0% | Household survey | 2013 | |
| 0.43% | 47.73% | 0.0% | 0.0% | 7.61% | 1.09% | 43.13% | 0.0% | 0.0% | 0.0% | Census | 2010 | |
| 6.0% | 61.0% | 27.0% | 0.0% | 0.0% | 0.0% | 0.0% | 0.0% | 2.0% | 4.0% | Household survey | 2006 | |
| 3.43% | 0.0% | 0.0% | 0.0% | 10.62% | 0.0% | 0.0% | 0.0% | 0.01% | 85.94% | Census | 2005 | |
| 2.0% | 81.8% | 7.7% | 5.7% | 1.91% | 0.21% | 0.0% | 0.0% | 0.0% | 0.68% | Census | 2011 | |
| 0.0% | 64.1% | 0.0% | 26.6% | 9.3% | 0.0% | 0.0% | 0.0% | 0.0% | 0.0% | Census | 2012 | |
| 0.0% | 13.6% | 0.0% | 67.6% | 18.3% | 0.0% | 0.0% | 0.0% | 0.0% | 0.0% | Household survey | 2006 | |
| 7.0% | 6.1% | 71.9% | 1.9% | 5.3% | 0.0% | 0.0% | 0.0% | 7.8% | 0.0% | Census | 2010 | |
| 0.2% | 12.7% | 86.3% | 0.0% | 0.1% | 0.0% | 0.0% | 0.0% | 0.6% | 0.0% | Census | 2007 | |
| 39.4% | 0.0% | 60.0% | 0.0% | 0.0% | 0.0% | 0.0% | 0.1% | 0.5% | 0.0% | Census | 2002 | |
| 6.70% | 7.87% | 82.93% | 0.0% | 1.40% | 0.0% | 0.0% | 0.55% | 0.55% | 0.0% | Census | 2013 | |
| 21.5% | 0.0% | 0.0% | 0.0% | 0.0% | 0.0% | 0.0% | 0.0% | 0.0% | 78.5% | Household survey | 2015 | |
| 6.0% | 0.0% | 0.0% | 0.0% | 0.0% | 0.0% | 0.0% | 0.4% | 2.2% | 91.4% | Census | 2005 | |
| 12.3% | 0.0% | 0.0% | 0.0% | 9.2% | 0.0% | 0.0% | 0.0% | 0.0% | 78.5% | Census | 2010 | |
| 1.8% | 0.0% | 0.0% | 0.0% | 0.0% | 0.0% | 0.0% | 0.0% | 0.0% | 98.2% | Census | 2012 | |
| 24.0% | 0.0% | 0.0% | 0.0% | 0.0% | 0.0% | 0.0% | 0.0% | 0.0% | 76.0% | Census | 2007 | |
| 0.5% | 75.8% | 0.0% | 0.0% | 12.4% | 0.2% | 3.3% | 0.0% | 7.8% | 0.0% | Census | 2010 | |
| 0.4% | 87.4% | 2.5% | 6.3% | 2.0% | 0.1% | 0.6% | 0.2% | 0.1% | 0.3% | Household survey | 2006 | |
| 0.0% | 43.6% | 0.0% | 0.0% | 3.6% | 0.0% | 51.6% | 0.0% | 1.2% | 0.0% | Census | 2011 |
Genetic studies
Argentina
Genetically, the composition of Argentina is mostly European in ancestry, with both Native American and African contributions.
A 2009 autosomal DNA study found that of the total Argentine population, 78.5 percent of the national genepool was European, 17.3 percent Native American, and 4.2 percent African.[43]
An unweighted autosomal study of blood donors from 2012 found the following composition among samples in four regions of Argentina: 65% European, 31% Native American and 4% African. The study's conclusion was not to achieve a generalized autosomal average of the country, but rather the existence of genetic heterogeneity among differing sample regions.[44]
Brazil
Genetic studies have shown the Brazilian population as a whole to have European, African and Native American components.
An autosomal study from 2013, with nearly 1300 samples from all of the Brazilian regions, found a predominant degree of European ancestry combined with African and Native American contributions, in varying degrees. 'Following an increasing North to South gradient, European ancestry was the most prevalent in all urban populations (with values up to 74%). The populations in the North consisted of a significant proportion of Native American ancestry that was about two times higher than the African contribution. Conversely, in the Northeast, Center-West and Southeast, African ancestry was the second most prevalent. At an intrapopulation level, all urban populations were highly admixed, and most of the variation in ancestry proportions was observed between individuals within each population rather than among population'.[45]
| Region[46] | European | African | Native American |
|---|---|---|---|
| North Region | 51% | 17% | 32% |
| Northeast Region | 56% | 28% | 16% |
| Central-West Region | 58% | 26% | 16% |
| Southeast Region | 61% | 27% | 12% |
| South Region | 74% | 15% | 11% |
An autosomal DNA study (2011), with nearly 1000 samples from all over the country ("whites", "pardos" and "blacks", according to their respective proportions), found a major European contribution, followed by a high African contribution and an important Native American component.[47] "In all regions studied, the European ancestry was predominant, with proportions ranging from 60.6% in the Northeast to 77.7% in the South".[48] The 2011 autosomal study samples came from blood donors (the lowest classes constitute the great majority of blood donors in Brazil[49]), and also public health institutions' personnel and health students. The study showed that Brazilians from different regions are more homogenous than previously thought by some based on the census alone. "Brazilian homogeneity is, therefore, a lot greater between Brazilian regions than within Brazilian regions".[50]
| Region[47] | European | African | Native American |
|---|---|---|---|
| Northern Brazil | 68.80% | 10.50% | 18.50% |
| Northeast of Brazil | 60.10% | 29.30% | 8.90% |
| Southeast Brazil | 74.20% | 17.30% | 7.30% |
| Southern Brazil | 79.50% | 10.30% | 9.40% |
According to a DNA study from 2010, "a new portrayal of each ethnicity contribution to the DNA of Brazilians, obtained with samples from the five regions of the country, has indicated that, on average, European ancestors are responsible for nearly 80% of the genetic heritage of the population. The variation between the regions is small, with the possible exception of the South, where the European contribution reaches nearly 90%. The results, published by the scientific magazine American Journal of Human Biology by a team of the Catholic University of Brasília, show that in Brazil, physical indicators such as skin colour, colour of the eyes and colour of the hair have little to do with the genetic ancestry of each person, which has been shown in previous studies (regardless of census classification).[51] "Ancestry informative SNPs can be useful to estimate individual and population biogeographical ancestry. Brazilian population is characterized by a genetic background of three parental populations (European, African, and Brazilian Native Amerindians) with a wide degree and diverse patterns of admixture. In this work we analyzed the information content of 28 ancestry-informative SNPs into multiplexed panels using three parental population sources (African, Amerindian, and European) to infer the genetic admixture in an urban sample of the five Brazilian geopolitical regions. The SNPs assigned apart the parental populations from each other and thus can be applied for ancestry estimation in a three hybrid admixed population. Data was used to infer genetic ancestry in Brazilians with an admixture model. Pairwise estimates of F(st) among the five Brazilian geopolitical regions suggested little genetic differentiation only between the South and the remaining regions. Estimates of ancestry results are consistent with the heterogeneous genetic profile of Brazilian population, with a major contribution of European ancestry (0.771) followed by African (0.143) and Amerindian contributions (0.085). The described multiplexed SNP panels can be useful tool for bioanthropological studies but it can be mainly valuable to control for spurious results in genetic association studies in admixed populations".[52] It is important to note that "the samples came from free of charge paternity test takers, thus as the researchers made it explicit: "the paternity tests were free of charge, the population samples involved people of variable socioeconomic strata, although likely to be leaning slightly towards the ‘‘pardo’’ group".[53]
| Region[53] | European | African | Native American |
|---|---|---|---|
| North Region | 71.10% | 18.20% | 10.70% |
| Northeast Region | 77.40% | 13.60% | 8.90% |
| Central-West Region | 65.90% | 18.70% | 11.80% |
| Southeast Region | 79.90% | 14.10% | 6.10% |
| South Region | 87.70% | 7.70% | 5.20% |
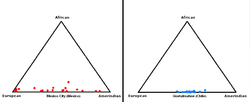
An autosomal DNA study from 2009 found a similar profile: "all the Brazilian samples (regions) lie more closely to the European group than to the African populations or to the Mestizos from Mexico".[54]
| Region[55] | European | African | Native American |
|---|---|---|---|
| North Region | 60.6% | 21.3% | 18.1% |
| Northeast Region | 66.7% | 23.3% | 10.0% |
| Central-West Region | 66.3% | 21.7% | 12.0% |
| Southeast Region | 60.7% | 32.0% | 7.3% |
| South Region | 81.5% | 9.3% | 9.2% |
A 2015 autosomal genetic study, which also analysed data of 25 studies of 38 different Brazilian populations concluded that: European ancestry accounts for 62% of the heritage of the population, followed by the African (21%) and the Native American (17%). The European contribution is highest in Southern Brazil (77%), the African highest in Northeast Brazil (27%) and the Native American is the highest in Northern Brazil (32%).[56]
| Region[56] | European | African | Native American |
|---|---|---|---|
| North Region | 51% | 16% | 32% |
| Northeast Region | 58% | 27% | 15% |
| Central-West Region | 64% | 24% | 12% |
| Southeast Region | 67% | 23% | 10% |
| South Region | 77% | 12% | 11% |
According to another autosomal DNA study from 2008, by the University of Brasília (UnB), European ancestry dominates in the whole of Brazil (in all regions), accounting for 65.90% of heritage of the population, followed by the African contribution (24.80%) and the Native American (9.3%).[57]
São Paulo state, the most populous state in Brazil, with about 40 million people, showed the following composition, according to an autosomal study from 2006: European genes account for 79% of the heritage of the people of São Paulo, 14% are of African origin, and 7% Native American.[58] A more recent study, from 2013, found the following composition in São Paulo state: 61.9% European, 25.5% African and 11.6% Native American.[59]
Chile
According to 1994 genetic research by Ricardo Cruz-Coke and Rodrigo Moreno, Chilean genetic admixture consists of 64% European, 35% Amerindian, and 1% African ancestry.[60] The European admixture goes from 81% in East Santiago to 61% in West Santiago. Valparaiso (Chilean central coast) and Concepción (central southern Chile) have 77% and 75% of European genetic admixture respectively.[60]
An autosomal DNA study from 2014 found the Chilean overall national genepool to be 44.34% (± 3.9%) Native American contribution, 51.85% (± 5.44%) European contribution, and 3.81% (± 0.45%) African contribution.[61] The samples came from all the 15 regions of Chile, and they were collected in Arica, as the researchers made it clear: "Beginning 2011, 923 volunteers from all 15 regions of Chile, living temporarily or permanently in Arica, with an average age of 28.05 ± 9.37 and belonging to social classes A and B (4%), CA and CB (60%) and D (36%) were invited to participate on this study".[62]
A 2015 autosomal DNA study found Chile to be 55.16% European, 42.38% Native American and 2.44% African (using LAMP-LD) and 43.22% Native American, 54.38% European and 2.40% African (using RFMix).[63]
Another 2015 autosomal DNA study carried out in two public hospitals found Chile to be 57.20% European, 38.70% Native American and 2.5% African.[64]
Chilean mitochondrial DNA and Y-chromosome studies indicate that European ancestry predominates in the Chilean upper class;[65] in the middle class the European component ranges from 72.3 to 76.8 percent,[65][66] and the Amerindian population ranges from 23.2 to 27.7 percent.[65][66] In the lower socioeconomic class, European ancestry is 62.9%–65 percent[65][66] and Amerindian ancestry is 35–37.1 percent.[65][66]
Colombia
In Colombia, an autosomal study found the following composition to be the contribution to the national genepool: 60.0% European, 32.0% Native and 8.0% SSA African.[67]
According to a 2015 autosomal DNA study Colombia is 62.50% European, 27.40% Native American and 9.2% African.[64]
This list shows the regional admixture in Colombia according to a 2016 DNA study with nearly 800 samples:[68]
| Region | European | Native American | African |
|---|---|---|---|
| Amazonía | 27.14% | 65.20% | 7.66% |
| Central | 58.86% | 36.04% | 5.10% |
| Caribbean | 55.01% | 22.01% | 22.98% |
| Greater Tolima | 54.54% | 37.34% | 8.12% |
| Orinoquía | 53.00% | 36.02% | 10.98% |
| Pacific | 22.72% | 14.01% | 63.27% |
| Paisa | 66.91% | 25.22% | 7.87% |
| Santanderes | 58.10% | 34.97% | 6.93% |
| Southwest | 48.65% | 44.28% | 7.07% |
| Valle del Cauca | 55.43% | 30.54% | 14.04% |
Costa Rica
.svg.png)
While the majority of Costa Ricans identify as of criollo or castizo descent, genetic studies demonstrate considerable pre-Columbian Amerindian and a smaller African ancestry.
According to an autosomal study, the genetic makeup of Costa Rica is 61 percent European, 30 percent Amerindian and nine percent African. Regional variation was observed, with greater European influence in the northern (66%) and central (65%) regions. Increased Amerindian ancestry was found in the south (38%), and a higher African contribution in coastal regions (13% in the Atlantic and 14% in the Pacific).[69]
The Central Valley—where more than half of Costa Ricans live—has a mestizo population with one of the highest European components in Latin America (comparable to Medellin, Colombia and Rio Grande do Sul, Brazil), areas with low pre-Columbian Native ancestry (then occupied by heterogeneous groups of hunter-gatherers) and where the current Native population is sparse. During the Spanish colonization of the Americas, Costa Rica was one of the more isolated regions in the Americas. According to genetic studies, the average Costa Rican from the Central Valley is 75 percent European, 20 percent Native and five percent African.[70] By the late 20th century allusions in textbooks and political discourse to "whiteness" and Spain as the "mother country" of all Costa Ricans were diminishing, replaced with a recognition of the many peoples comprising the nation.[71]
Cuba
An autosomal study from 2014 has found the genetic ancestry in Cuba to be 70% European, 22% African and 8% Native American.[72]
Dominican Republic
According to a recent autosomal study, the genetic composition of the Dominican Republic was 51.2 percent European, 41.8 percent African and 8 percent Native.[73]
Ecuador
According to a 2010 DNA autosomal study, the genetic composition of genepool of Ecuadorians is 48.8% Native American, 38.9% European, and 12.3% African.[74]
El Salvador
A large majority of the population is declared mestizos. El Salvador is one of the most homogeneous countries in Latin America. According to a genetic research by the University of Brasilia, Salvadoran genetic admixture consists of a national genepool with a 45.2% Amerindian contribution, 45.2% European contribution, and 9.6% African ancestry contribution.[75]
Guatemala
The study "Geographic Patterns of Genome Admixture in Latin American Mestizos" by PLoS Genetics found that the composition of Guatemala is 55% European, 44% Amerindian, and less than 1% African or Asian.[70]
Mexico
An autosomal DNA study by the American Journal of Human Genetics estimated that the average admixture of Mexicans is approximately 52% European, 45% Amerindian, and 4% African. Higher Amerindian ancestry on the X chromosome was observed, consistent with predominantly European patrilineal and Native American matrilineal ancestry.[76]
Another autosomal study comparing the ethnic makeup of five different Latin American countries — Mexico, Colombia, Dominican Republic, Ecuador, and Puerto Rico — found Mexico to be 50.1% Native American and 5.6% African, having the highest Native and the lowest African contribution of the sample.[67]
A study by Mexico's National Institute of Genomic Medicine (INMEGEN) reported that mestizo Mexicans are 58.96% European, 35.05% "Asian" (primarily Amerindian) and 5.03 percent African. Sonora has the highest European contribution (70.63 percent) and Guerrero the lowest (51.98 percent, with the highest Asian contribution: 37.17 percent). The African contribution ranges from 2.8 percent in Sonora to 11.13 percent in Veracruz. Eighty percent of the population was classified as mestizo (racially mixed to some degree). The study was conducted among volunteers from six states (Sonora, Zacatecas, Veracruz, Guanajuato, Oaxaca and Yucatan) and an indigenous group, the Zapotecs.[77]
The same study found that Mexico's haplogroup was most similar to the European group with 81 percent of haplotypes shared, followed by the Asian haplogroup with 74 percent and the African haplogroup with 64 percent. The investigators also noted that the African admixture did not generally come from African slaves brought by Europeans to the Americas, but rather, it was already a part of the genetic admixture of the Iberian colonists.[78]
A study in Mexico City found that its mestizo population had the greatest variation in Latin America, with its mestizos being either largely European or Amerindian rather than having a uniform admixture. The study's results are similar to those by INMEGEN in which the European admixture is 56.8 percent, followed by Asian (Native American) ancestry with 39.8 percent and an African contribution of 3.4 percent.[70] Additional studies suggest a correlation between greater European admixture with a higher socioeconomic status, and greater Amerindian ancestry with a lower socioeconomic status. A study of low-income Mexicans found the mean admixture to be 0.590, 0.348 and 0.062 Amerindian, European and African respectively,[79] while a study of Mexicans with an income higher than the mean found their European admixture to be 82 percent.[80]
Peru
According to genetic research by the University of Brasilia, Peruvian genetic admixture consists of 51.0% Amerindian, 37.1% European, and 11.9% African ancestry.[75]
According to a 2015 DNA autosomal study, the composition of Peru is: 47.30% Native American, 47% European and 3.2% African.[64]
Uruguay
A 2009 DNA study in the American Journal of Human Biology showed the genetic contribution to the genepool of Uruguay as a whole is primarily derived from Europe, with Native American ancestry ranging from 1 to 10 percent and African from 7 to 15 percent (depending on region).[81] A 2014 study, "in agreement with those obtained from a study using nDNA", put the average "for the whole country" (but which thus may vary region-wise) as 6% African and 10% Native American.[82]
See also
References
- ↑ Administrador. "Diversidad / Diversidad Étnico-Racial - Principal".
- ↑ Aske, Jon. "Hispanics and Race".
- ↑ Aske, Jon. "Some historical background".
- ↑ McNeill, William H. (1991). The Rise of the West: A History of the Human Community. The University of Chicago Press. , p. 603
- ↑ Wright, Thomas C. (2017). Latin America since Independence: Two Centuries of Continuity and Change. Rowman & Littlefield. , pp. 30 - 31
- 1 2 "Field Listing: Ethnic groups". The CIA World Factbook. Retrieved November 24, 2016.
- 1 2 3 4 5 Lizcano Fernández, Francisco (2005). "Composición Étnica de las Tres Áreas Culturales del Continente Americano al Comienzo del Siglo XXI" [Ethnic Composition of Three Cultural Areas of the Americas at Beginning of the XXI Century] (PDF). Convergencia (in Spanish). Mexico: Universidad Autónoma del Estado de México, Centre for Research in Social Sciences and Humanities. 38 (May–August): 185–232. ISSN 1405-1435. Archived from the original (PDF) on September 20, 2008: see table on page 218
- ↑ Shoji, Rafael (2004). "Reinterpretação do Budismo Chinês e Coreano no Brasil" [Reinterpretation of Buddhism of the Chinese and Koreans in Brazil] (PDF). Revista de Estudos da Religião (in Portuguese) (3): 74–87. ISSN 1677-1222. Retrieved October 31, 2016.
- ↑ "Japan-Brazil Relations". MOFA. Retrieved May 23, 2012.
- ↑ 재외동포현황 [Status of Overseas Koreans] (in Korean). South Korea: Ministry of Foreign Affairs and Trade. 2009. Archived from the original on October 23, 2010. Retrieved May 21, 2009.
- ↑ "The Ranking of Ethnic Chinese Population". Overseas Compatriot Affairs Commission (Taiwan). 2004. Archived from the original on November 23, 2013. Retrieved July 26, 2010.
- ↑ Palma, Hugo (March 12, 2008). "Desafíos que nos acercan" [Challenges that bring us closer] (in Spanish). Universia.edu.pe. Archived from the original on April 15, 2009. Retrieved July 26, 2010.
- ↑ "Martinique". The World Factbook. USA: CIA. 2003. Retrieved February 6, 2010.
- ↑ "Cronología de la abolición de la esclavitud". Sandiilessa.wordpress.com. Retrieved May 23, 2012.
- ↑ Stavenhagen, Rodolfo (1987). "Pensar a los indios, tarea de criollos" (PDF) (in Spanish). IIHR. Archived from the original (PDF) on October 22, 2007.
- ↑ "Latinoamerican" (PDF). Revistas.ucm.es. Retrieved May 23, 2012.
- ↑ "South America: Postindependence overseas immigrants". Britannica Online Encyclopedia. Retrieved February 10, 2008.
- ↑ "En detrimento de Israel Acercamiento arabe a America Latina". Delacole.com. February 16, 2011. Retrieved May 23, 2012.
- ↑ "Latinoamérica" (PDF). Retrieved May 23, 2012.
- ↑ Stranded in Paradise: Shipwrecked Hundreds of Years Ago, the Garifuna Are Still Trying to Find Their Way by Teresa Wiltz, The Washington Post.
- ↑ Population obtained from U.S. Census Bureau, International Data Base, accessed on October 5, 2011.
- ↑ "Informe Latinobarómetro 2016". Slideshare.net. October 6, 2016. Retrieved November 1, 2016.
- ↑ "Datos Geográficos | Embajada de la República Argentina" (in Spanish).
- ↑ |"Encuesta de Ipsos Apoyo, Opinión y Mercado". 2013 (in Spanish).
- ↑ "Tabela 1.3.1 - População residente, por cor ou raça, segundo o sexo e os grupos de idade - Brasil - 2010" (PDF). IBGE (in Portuguese). Retrieved 2017-05-23.
- ↑ |"World Values Survey 2006 Chile" (PDF). 2006 (in Spanish).
- ↑ "COLOMBIA UNA NACIÓN MULTICULTURAL: Su diversidad étnica" (PDF). 2005 Census (in Spanish). DANE. May 2007. p. 37.
- ↑ "Censo de Población y Vivienda 2000". 2000 Census (in Spanish). ECLAC. Archived from the original on 2012-06-30.
- ↑ "El Color de la Piel según el Censo de Población y Viviendas" (PDF) (in Spanish). Oficina Nacional de Estadísticas.
- ↑ "La variable étnico racial en los censos de población en la República Dominicana" [The racial ethnic variable in the population census in the Dominican Republic] (in Spanish). Dominican Republic National Bureau of Statistics. July 2012. Archived from the original (PDF) on July 29, 2013.
- ↑ "Resultados del Censo 2010". 2010 Census (in Spanish). INEC.
- ↑ "Censo de Población de Vivienda 2007" [Population and Housing Census 2007] (PDF). Department of Statistics and Censuses, Republic of El Salvador (in Spanish). November 4, 2007. p. 13.
- ↑ Censo 2002 .
- ↑ "XVII Censo de Población y VI de Vivienda 2013". 2013 (in Spanish). INE.
- ↑ "Encuesta Intercensal 2015" (PDF) (in Spanish). INEGI. 2015. Retrieved 2017-06-05.
- ↑ "Nicaragua: Documento para Discusión sobre los Pueblos Indígenas y AfroDescendientes". 2007 (in Spanish). BID.
- ↑ "INEC::Perspectiva étnica de los censos nacionales de población y de vivienda de 201" (PDF). 2010 (in Spanish). CEPAL.
- ↑ "Pueblos Indígenas en el Paraguay, Resultados finales de población y vivienda 2012" (PDF). 2012 Census (in Spanish). Dirección General de Estadística, Encuestas y Censos.
- ↑ "Diagnóstico Sociodemográfico de los Pueblos Indígenas de Perú" (PDF). 2010 Census (in Spanish). CEPAL.
- ↑ "2010 Census: Puerto Rico Profile" (PDF). United States Census Bureau. 2010.
- ↑ "El perfil demográfico y socioeconómico de la población uruguaya según su ascendencia racial". 2006 (in Spanish). Instituto Nacional de Estadística. p. 15. Retrieved 2017-05-22.
- ↑ "XIV Censo nacional de población y vivienda: Resultados total nacional de la República Bolivariana de Venezuela" [XIV National Census of Population and Housing: Total national results for the Bolivarian Republic of Venezuela] (PDF). 2011 Census (in Spanish). INE. May 2014. p. 29. Retrieved May 22, 2017.
- ↑ Corach, D; Lao, O; Bobillo, C; et al. (2009-12-15). "Inferring Continental Ancestry of Argentineans from Autosomal, Y-Chromosomal and Mitochondrial DNA". Annals of Human Genetics. 74 (1): 65–76. doi:10.1111/j.1469-1809.2009.00556.x. PMID 20059473. Retrieved 2013-09-06.
- ↑ "Heterogeneity in Genetic Admixture across Different Regions of Argentina". PLoS ONE. April 10, 2012. Retrieved November 1, 2016.
- ↑ Lins, T. C.; et al. (September 2013). "Revisiting the Genetic Ancestry of Brazilians Using Autosomal AIM-Indels" (PDF). PLoS ONE. 8 (9): 187–192. Bibcode:2013PLoSO...875145S. doi:10.1371/journal.pone.0075145. PMC 3779230. PMID 24073242. Retrieved November 4, 2016.
- ↑ Lins, T. C.; et al. (March–April 2009). "Genetic composition of Brazilian population samples based on a set of twenty-eight ancestry informative SNPs". American Journal of Human Biology. 22 (2): 187–192. doi:10.1002/ajhb.20976. PMID 19639555.
- 1 2 Pena, Sérgio D. J.; et al. (February 16, 2011). "The Genomic Ancestry of Individuals from Different Geographical Regions of Brazil Is More Uniform Than Expected". PLoS ONE. 6 (2): e17063. Bibcode:2011PLoSO...617063P. doi:10.1371/journal.pone.0017063. PMC 3040205. PMID 21359226.
- ↑ (PDF) http://www4.ensp.fiocruz.br/informe/anexos/ric.pdf. Retrieved August 19, 2017. Missing or empty
|title=(help) - ↑ "Profile of the Brazilian blood donor". Archived from the original on May 2, 2012.
- ↑ Drago, Carolina (February 24, 2011). "Nossa herança europeia" [Our European heritage] (in Portuguese). cienciahoje.org.br. Retrieved November 4, 2016.
- ↑ Lopes, Reinaldo José (October 5, 2009). "DNA de brasileiro é 80% europeu, indica estudo" [Brazilian DNA is 80% European, study shows] (in Portuguese). Folha de S.Paulo. Retrieved November 4, 2016.
- ↑ Lins, TC; Vieira, RG; Abreu, BS; Grattapaglia, D; Pereira, RW (2010). "Genetic composition of Brazilian population samples based on a set of twenty-eight ancestry informative SNPs". Am. J. Hum. Biol. 22 (2): 187–92. doi:10.1002/ajhb.20976. PMID 19639555.
- 1 2 Lins, TC; Vieira, RG; Abreu, BS; Grattapaglia, D; Pereira, RW (2010). "Genetic composition of Brazilian population samples based on a set of twenty-eight ancestry informative SNPs". Am. J. Hum. Biol. 22 (2): 187–92. doi:10.1002/ajhb.20976. PMID 19639555.
- ↑ De Assis Poiares, L; De Sá Osorio, P; Spanhol, F. A.; Coltre, S. C.; Rodenbusch, R; Gusmão, L; Largura, A; Sandrini, F; Da Silva, C. M. (Feb 2010). "Allele frequencies of 15 STRs in a representative sample of the Brazilian population". Forensic Sci Int Genet. 4 (2): e61–3. doi:10.1016/j.fsigen.2009.05.006. PMID 20129458.
- ↑ de Assis Poiares, Lilian; et al. (2010). "Allele frequencies of 15 STRs in a representative sample of the Brazilian population" (PDF). Forensic Science International: Genetics. Elsevier. 4 (2): e61–e63. doi:10.1016/j.fsigen.2009.05.006. PMID 20129458. Archived from the original (PDF) on April 8, 2011: Blood samples from 12,886 unrelated individuals representative of the mixed ethnicity present in Brazil, with 8.26% of the individuals from the North region, 23.86% from the Northeast, 4.79% from the Central West, 10.32% from the Southeast and 52.77% from the South.
- 1 2 Rodrigues De Moura, Ronald; Coelho, Antonio Victor Campos; De Queiroz Balbino, Valdir; Crovella, Sergio; Brandão, Lucas André Cavalcanti (2015). "Meta-analysis of Brazilian genetic admixture and comparison with other Latin America countries". American Journal of Human Biology. 27 (5): 674. doi:10.1002/ajhb.22714. PMID 25820814.
- ↑ de Oliveira Godinho, Neide Maria (2008). "O impacto das migrações na constituição genética de populações Latino-Americanas" [The impact of migration on the genetic makeup of Latin American populations] (PDF) (in Portuguese). University of Brazil. Retrieved November 4, 2016.
- ↑ Ferreira, Luzitano Brandão; Mendes, Celso Teixeira; Wiezel, Cláudia Emília Vieira; Luizon, Marcelo Rizzatti; Simões, Aguinaldo Luiz (September 1, 2006). "Genomic ancestry of a sample population from the state of São Paulo, Brazil". Am. J. Hum. Biol. 18 (5): 702–705. doi:10.1002/ajhb.20474 – via Wiley Online Library.
- ↑ Manta, Fernanda Saloum de Neves; et al. (September 20, 2013). "Revisiting the Genetic Ancestry of Brazilians Using Autosomal AIM-Indels". PLoS ONE. 8 (9): e75145. Bibcode:2013PLoSO...875145S. doi:10.1371/journal.pone.0075145. PMC 3779230. PMID 24073242 – via PLoS Journals.
- 1 2 Cruz-Coke, R; Moreno, RS (September 1994). "Genetic epidemiology of single gene defects in Chile" (PDF). Ricardo Cruz-Coke and Rodrigo Moreno (in Spanish). 31 (9): 702–6. doi:10.1136/jmg.31.9.702. PMC 1050080. PMID 7815439. Retrieved 12 Apr 2013.
- ↑ Fuentes, Macarena; et al. (2014). "Geografía génica de Chile. Distribución regional de los aportes genéticos americanos, europeos y africano" [Gene geography of Chile. Regional distribution of American, European and African genetic contributions] (PDF). Revista médica de Chile (in Spanish). Sociedad Médica de Santiago. 142 (3): 281–289. doi:10.4067/s0034-98872014000300001. ISSN 0034-9887. PMID 25052264. Retrieved November 1, 2016.
- ↑ "Gene geography of Chile: Regional distribution of American, European and African genetic contributions". Scielo.cl. 1990-01-06. Retrieved 2016-11-01.
- ↑ Eyheramendy, Susana; Felipe I. Martinez; Federico Manevy; Cecilia Vial; Gabriela M. Repetto (2015). "Genetic structure characterization of Chileans reflects historical immigration patterns". Nature Communications. Springer Nature. 6: 6472. Bibcode:2015NatCo...6E6472E. doi:10.1038/ncomms7472. PMC 4382693. PMID 25778948. Retrieved November 1, 2016.
- 1 2 3 Homburger, Julian R.; Moreno-Estrada, Andrés; Gignoux, Christopher R.; Nelson, Dominic; Sanchez, Elena; Ortiz-Tello, Patricia; Pons-Estel, Bernardo A.; Acevedo-Vasquez, Eduardo; Miranda, Pedro; Langefeld, Carl D.; Gravel, Simon; Alarcón-Riquelme, Marta E.; Bustamante, Carlos D. (2015). "Genomic Insights into the Ancestry and Demographic History of South America". PLOS Genetics. 11 (12): e1005602. doi:10.1371/journal.pgen.1005602. PMC 4670080. PMID 26636962.
- 1 2 3 4 5 "El estrato socioeconómico alto se constituye mayoritariamente por una población caucásica y el estrato bajo por una mezcla de población caucásica 65% y amerindia 35% Revista médica de Chile".
- 1 2 3 4 M. Acuña1, H. Jorquera2, L. Cifuentes1 and L. Armanet3. "Frequency of the hypervariable DNA loci D18S849, D3S1744, D12S1090 and D1S80 in a mixed ancestry population of Chilean blood donors". 1ICBM Genetic Program and Medical Technology School, Facultad de Medicina, Universidad de Chile.
- 1 2 Bryc, K; Velez, C; Karafet, T; et al. (May 2010). "Colloquium paper: genome-wide patterns of population structure and admixture among Hispanic/Latino populations". Proc. Natl. Acad. Sci. U.S.A. 107 Suppl 2: 8954–61. Bibcode:2010PNAS..107.8954B. doi:10.1073/pnas.0914618107. PMC 3024022. PMID 20445096.
- ↑ http://journals.plos.org/plosone/article?id=10.1371/journal.pone.0164414
- ↑ Morera, B; Barrantes, R; Marin-Rojas, R (2013-03-25). "Gene admixture in the Costa Rican population". Ann. Hum. Genet. 67 (Pt 1): 71–80. doi:10.1046/j.1469-1809.2003.00010.x. PMID 12556237.
- 1 2 3 4 Wang, S; Ray, N; Rojas, W; et al. (2008-03-21). "Geographic Patterns of Genome Admixture in Latin American Mestizos". PLOS Genetics. 4 (3): e1000037. doi:10.1371/journal.pgen.1000037. PMC 2265669. PMID 18369456. Retrieved 2013-09-09.
- ↑ "Culture of Costa Rica - history, people, women, beliefs, food, customs, family, social, marriage". Everyculture.com. Retrieved 2013-09-06.
- ↑ Marcheco-Teruel, Beatriz; Parra, Esteban J.; Fuentes-Smith, Evelyn; Salas, Antonio; Buttenschøn, Henriette N.; Demontis, Ditte; Torres-Español, María; Marín-Padrón, Lilia C.; Gómez-Cabezas, Enrique J.; Álvarez-Iglesias, Vanesa; Mosquera-Miguel, Ana; Martínez-Fuentes, Antonio; Carracedo, Ángel; Børglum, Anders D.; Mors, Ole (2014). "Cuba: Exploring the History of Admixture and the Genetic Basis of Pigmentation Using Autosomal and Uniparental Markers". PLoS Genetics. 10 (7): e1004488. doi:10.1371/journal.pgen.1004488. PMC 4109857. PMID 25058410.
- ↑ Bryc, K.; et al. (2010). "Genome-wide patterns of population structure and admixture among Hispanic/Latino populations" (PDF). PNAS. Proceedings of the National Academy of Sciences. 107 (Suppl 2): 8954–8961. Bibcode:2010PNAS..107.8954B. doi:10.1073/pnas.0914618107. PMC 3024022. PMID 20445096. Retrieved November 4, 2016.
- ↑ Bryc; et al. (2010). "Genome-wide patterns of population structure and admixture among Hispanic/Latino populations".
- 1 2 Godinho, Neide Maria de Oliveira (2008). "O impacto das migrações na constituição genética de populações latino-americanas" (PDF). Universidade de Brasília. Archived from the original on July 6, 2011. Retrieved 29 October 2012.
- ↑ Price, AL; Patterson, N; Yu, F; Cox, DR; Waliszewska, A; McDonald, GJ; Tandon, A; Schirmer, C; Neubauer, J; Bedoya, G; Duque, C; Villegas, A; Bortolini, MC; Salzano, FM; Gallo, C; Mazzotti, G; Tello-Ruiz, M; Riba, L; Aguilar-Salinas, CA; Canizales-Quinteros, S; Menjivar, M; Klitz, W; Henderson, B; Haiman, CA; Winkler, C; Tusie-Luna, T; Ruiz-Linares, A; Reich, D (2007). "A genomewide admixture map for Latino populations". Am. J. Hum. Genet. 80 (6): 1024–36. doi:10.1086/518313. PMC 1867092. PMID 17503322.
- ↑ J.K. Estrada; A. Hidalgo-Miranda; I. Silva-Zolezzi; G. Jimenez-Sanchez. "Evaluation of Ancestry and Linkage Disequilibrium Sharing in Admixed Population in Mexico". ASHG. Retrieved July 18, 2012.
- ↑ "Genoma destapa diferencias de mexicanos". CNN Expansión. 2009-06-06. Retrieved 2013-09-09.
- ↑ Lisker, Rubén; Ramírez, Eva; González-Villalpando, Clicerio; Stern, Michael P. (2005-05-27). "Racial admixture in a Mestizo population from Mexico City". American Journal of Human Biology. 7 (2): 213–216. doi:10.1002/ajhb.1310070210.
- ↑ "Admixture in Mexico City: implications for admixture mapping of Type 2 diabetes genetic risk factors" (PDF). Utm.utoronto.ca. 2006-10-02. Retrieved 2013-09-09.
- ↑ Bonilla, Carolina; Bertoni, Bernardo; González, Susana; Cardoso, Horacio; Brum-Zorrilla, Nadir; Sans, Mónica (2004). "Substantial native American female contribution to the population of Tacuarembó, Uruguay, reveals past episodes of sex-biased gene flow". American Journal of Human Biology. 16 (3): 289. doi:10.1002/ajhb.20025. PMID 15101054.
- ↑ Salzano, FM; Sans, M (2014). "Interethnic admixture and the evolution of Latin American populations". Genetics and Molecular Biology. 37 (1 Suppl): 151–70. PMID 24764751. External link in
|title=(help)