El Salto, Durango
| El Salto | |
|---|---|
| Municipal Seat and City | |
|
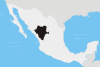
El Salto Location in Mexico | |
| Coordinates: 23°46′56.424″N 105°21′30.5958″W / 23.78234000°N 105.358498833°WCoordinates: 23°46′56.424″N 105°21′30.5958″W / 23.78234000°N 105.358498833°W | |
| Country |
|
| State | Durango |
| Municipality | Pueblo Nuevo |
| Elevation | 2,580 m (8,460 ft) |
| Population (2010) | |
| • Total | 24,241 |
El Salto is a town and seat of the municipality of Pueblo Nuevo in the southwestern part of the Mexican state of Durango. It is by far the largest town on Federal Highway 40 between the city of Durango and Mazatlán, Sinaloa. As of 2010, the town had a total population of 24,241,[1]
Situated on a pine-forested plateau about 2,580 meters (8,465 feet) above sea level in the Sierra Madre mountain range, the town is home to a large lumber industry. It also has a military base. The surrounding municipality has an area of 6,178.3 km² (2,385.45 sq mi) and a population of 50,417.[2] Its largest other community is the town of La Ciudad, in the western part of the municipality.
Climate
| Month | Jan | Feb | Mar | Apr | May | Jun | Jul | Aug | Sep | Oct | Nov | Dec | Year |
|---|---|---|---|---|---|---|---|---|---|---|---|---|---|
| Record high °C (°F) | 30.0 (86) |
29.0 (84.2) |
32.0 (89.6) |
37.0 (98.6) |
34.0 (93.2) |
34.0 (93.2) |
31.0 (87.8) |
32.0 (89.6) |
28.0 (82.4) |
31.0 (87.8) |
28.0 (82.4) |
25.5 (77.9) |
37 (98.6) |
| Average high °C (°F) | 16.8 (62.2) |
18.3 (64.9) |
19.9 (67.8) |
21.9 (71.4) |
23.6 (74.5) |
24.4 (75.9) |
22.9 (73.2) |
22.5 (72.5) |
21.4 (70.5) |
20.3 (68.5) |
19.1 (66.4) |
17.4 (63.3) |
20.7 (69.3) |
| Daily mean °C (°F) | 5.7 (42.3) |
6.1 (43) |
7.7 (45.9) |
9.9 (49.8) |
12.2 (54) |
15.0 (59) |
15.4 (59.7) |
15.3 (59.5) |
14.2 (57.6) |
10.9 (51.6) |
7.7 (45.9) |
6.2 (43.2) |
10.5 (50.9) |
| Average low °C (°F) | −5.4 (22.3) |
−6.1 (21) |
−4.4 (24.1) |
−2.2 (28) |
0.8 (33.4) |
5.7 (42.3) |
8.0 (46.4) |
8.1 (46.6) |
7.0 (44.6) |
1.6 (34.9) |
−3.6 (25.5) |
−5.0 (23) |
0.4 (32.7) |
| Record low °C (°F) | −13.5 (7.7) |
−15.0 (5) |
−12.0 (10.4) |
−12.0 (10.4) |
−12.0 (10.4) |
−8.0 (17.6) |
−5.0 (23) |
−8.0 (17.6) |
−5.0 (23) |
−10.0 (14) |
−12.0 (10.4) |
−15.0 (5) |
−15 (5) |
| Average precipitation mm (inches) | 55.7 (2.193) |
20.9 (0.823) |
16.7 (0.657) |
12.4 (0.488) |
27.5 (1.083) |
130.8 (5.15) |
195.5 (7.697) |
183.3 (7.217) |
150.3 (5.917) |
65.5 (2.579) |
24.4 (0.961) |
64.8 (2.551) |
947.8 (37.315) |
| Average precipitation days (≥ 0.1 mm) | 3.4 | 1.5 | 1.1 | 1.4 | 3.2 | 11.6 | 17.3 | 16.7 | 12.4 | 5.2 | 2.0 | 3.9 | 79.7 |
| Source: Servicio Meteorológico National[3] | |||||||||||||
References
- ↑ "Pueblo Nuevo". Catálogo de Localidades. Secretaría de Desarrollo Social (SEDESOL). Retrieved 23 April 2014.
- ↑ http://cuentame.inegi.org.mx/monografias/informacion/dur/poblacion/default.aspx?tema=me&e=10
- ↑ "NORMALES CLIMATOLÓGICAS 1951-2010". Servicio Meteorológico National. Archived from the original on December 19, 2013. Retrieved October 9, 2012.
- Link to tables of population data from Census of 2005 INEGI: Instituto Nacional de Estadística, Geografía e Informática
- Durango Enciclopedia de los Municipios de México
This article is issued from
Wikipedia.
The text is licensed under Creative Commons - Attribution - Sharealike.
Additional terms may apply for the media files.