Demography of Cornwall
Cornwall is a unitary authority and ceremonial county of England, in the United Kingdom. At the 2011 census it had a population of 536,000. Cornwall is the homeland of the Cornish people and many within Cornwall identify with a Cornish ethnic or national identity, although due to Cornwall's political status as part of England, the United Kingdom and the European Union, as well as in-migration from other parts of the UK and EU, additional identities such as English, British and European may also be adopted.
Ethnicity
In the 2011 census, the following results were given for ethnic identity.[1] The option to describe ethnicity as Cornish was officially advertised within Cornwall, as well as tickboxes for English, Welsh, Scottish, Northern Irish and British on the census form, however these were all amalgamated into White British for the purposes of the census results.
- White (Cornish/English/Welsh/Scottish/Northern Irish/British): 95.7%
- White (Irish): 0.4%
- White (Gypsy or Irish Traveller): 0.1%
- White (Other White): 2.0%
- Mixed (White and Black Caribbean): 0.2%
- Mixed (White and Black African): 0.1%
- Mixed (White and Asian): 0.3%
- Mixed (Other Mixed): 0.2%
- Asian/Asian British (Indian): 0.2%
- Asian/Asian British (Pakistani): 0.0%
- Asian/Asian British (Bangladeshi): 0.1%
- Asian/Asian British (Chinese): 0.2%
- Asian/Asian British (Other Asian): 0.2%
- Black/African/Caribbean/Black British (African): 0.1%
- Black/African/Caribbean/Black British (Caribbean): 0.1%
- Black/African/Caribbean/Black British (Other Black): 0.0%
- Other (Arab): 0.0%
- Other (Other): 0.1%
National identity
In the 2011 census, the following results were given for national identity.[1] 'Cornish' was not provided as a tickbox on the census form, which it has been argued results in an undercount of Cornish national identity, although it was allocated a separate category in the results.
|
|
|
|
|
|
|
|
|
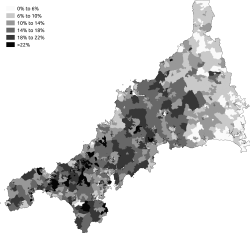
Cornish identity
Overall, most people in Cornwall indentify as having no Cornish identity.[2]
- Some form of Cornish identity: 13.8%
- Cornish only identity: 9.9%
- Cornish and British only indentity: 1.0%
- Cornish and English/Welsh/Scottish/Northern Irish indentities: 2.9%
- No Cornish identity: 86.2%
Country of birth
In the 2011 census, the following results were given for country of birth:[1]
- United Kingdom: 95.6%
- England: 92.7%
- Wales: 1.4%
- Scotland: 1.2%
- Northern Ireland: 0.3%
- United Kingdom not otherwise specified: 0.0%
- Ireland: 0.3%
- Other EU countries: 1.8%
- EU member states in March 2001: 1.0%
- EU accession states April 2001 to March 2011: 0.8%
- Other: 2.4%
Household language
In the 2011 census, the following results were given for household languages other than English:[2]
- At least one person in the household have English as their main language: 2360
- No people in household have English as their main language: 2155
Overall, 98% of people in Cornwall aged 16 or over have English as their main language.[2]
Religion
Cornwall has the 4th highest proportion of people who say they are pagan in England and Wales.
In the 2011 census, the following results were given for religion:[1]
- Christian: 59.8%
- No religion: 30.31%
- Religion not stated: 8.52%
- Other religion: 0.69%
- Buddhist: 0.32%
- Muslim: 0.16%
- Hindu: 0.10%
- Jewish: 0.07%
- Sikh: 0.02%
Among those with 'No religion' or 'Other religion', the following results were given:[2]
- Jedi Knight: 32%
- Pagan: 21%
- Other: 21%
- Spiritualist: 8%
- Mixed Religion: 8%
- Agnostic: 6%
- Atheist: 4%
Results combined into 'other' include Humanist, Spiritual, Wicca, Taoist, Druid, Rastafarian, Pantheneismm Baha’i, own belief system, believe in God, Satanism, Witchcraft, Heathen, Animism, Shamanism, Scientology, Universalist, Deist, Theism, New Age, Shintoism, Zoroastrian, Occult, Eckankar, Mysticism, Traditional African Religion, Ravidassia, Church of all religion, reconstructionist, Thelemite, Vodun, Confucianist, Jain, Native American Church, Unification Church, Brhama Kumari, Chinese Religion and Druze.
Religion change 2001-2011
At the 2011 census, the results for the following religions changed:
- Hindu: 133% change (actual change +317 responses)
- No religion: 94% change (actual change +78060 responses)
- Buddhist: 84% change (actual change +788 responses)
- Other religion: 56% change (actual change +1295 responses)
- Muslim: 27% change (actual change +183 responses)
- Religion not stated: 13% change (actual change +5228 responses)
- Sikh: 1% change (actual change +1 response)
- Jewish: -11% change (actual change -46 responses)
- Christian: -14% change (actual change -52666 responses)
Health
In the 2011 census, the following results were given for personal health and wellbeing:[2]
General health
Most people in Cornwall indentify their health as 'good' but the proportion of those in good health is slightly lower than the national average (at 81.2%). The proportion of those indentifying their health as 'bad' was similar to those over the whole of the England and Wales (5.6%).[2]
- In good health: 78.8% (an increase of 12.6% since 2001)
- In bad health: 6.3% (a decrease of 3.6% since 2001)
Limitation of day to day acivities
- Limits day to day activities 'a lot': 10.0%
- Limits day to day activities 'a little': 11.4%
- Day to day activities 'not limited': 78.6%
Carers
- Undertakes unpaid care every week: 11.9% (an increase of 0.6% since 2001)
- Provides 1-19 hours of unpaid care per week: 7.3%
- Provides 20-49 hours of unpaid care per week: 1.6%
- Provides more than 50 hours of unpaid care per week: 3.0%
Marital status
At the 2011 census, 50% of Cornwall's population were married.[2]
The following results were given for marital status:[2]
- Married: 222,141
- Single (never married or registered in a same-sex civil partnership): 125,475
- Divorced or formally in a same-sex civil partnership which is now legally dissolved: 47,858
- Widowed or surviving partner from a same-sex civil partnership: 36,376
- Separated (but still legally married or in a same-sex civil partnership): 9582
- In a registered same-sex civil partnership: 900
References
Cornwall Portal | |
| Unitary authorities | |
| Major settlements |
|
| Rivers | |
| Topics | |