Dasymetric map
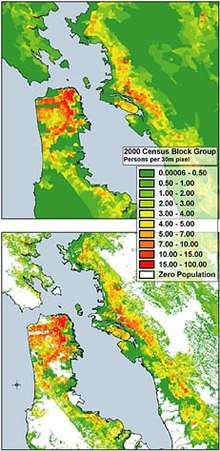
The dasymetric map is a method of thematic mapping, which uses areal symbols to spatially classify volumetric data. The method was defined and developed in 1911 by Benjamin (Veniamin) Petrovich Semenov-Tyan-Shansky[2] and popularised by J.K. Wright, although there are earlier references to similar techniques from George Poulett Scrope (1833)[2] and Henry Drury Harness (1838).[3][4]
Mapping
The term "dasymetric" was invented by Semenov-Tyan-Shansky using the Greek translation for "measuring density" (dasys – dense, metreo – to measure).[2] Semenov-Tyan-Shansky defined dasymetric maps as maps "on which population density, irrespective of any administrative boundaries, is shown as it is distributed in reality, i.e. by natural spots of concentration and rarefaction."[2] Cartographers use dasymetric mapping for population density over other methods because of its ability to realistically place data over geography. Considered a hybrid or compromise between isopleth and choropleth maps,[5][6] a dasymetric map utilizes standardized data, but places areal symbols by taking into consideration actual changing densities within the boundaries of the map. To do this, ancillary information is acquired, which means the cartographer steps statistical data according to extra information collected within the boundary. If appropriately executed, it is far superior to choropleth maps in relaying statistical data within areas of interest.
Like other forms of thematic mapping, the dasymetric method was created and historically used because of the need for accurate visualization methods of population data. Dasymetric maps are not widely used because of the limited options for producing them with automated tools such as geographic information systems. Although fields such as public health still rely on choropleth maps, dasymetric maps are becoming more prevalent in developing fields, such as conservation and sustainable development. Researchers in various fields of science are pushing the way for use of so-called critical GIS and to make dasymetric mapping techniques more easily applicable with modern technology.
References
- ↑ "Western Geographic Science Center". Retrieved 13 November 2015.
- 1 2 3 4 Petrov, Andrey (2012). "One Hundred Years of Dasymetric Mapping: Back to the Origin". The Cartographic Journal. 49 (3): 256–264.
- ↑ Harness, Henry D. (1838). Atlas to Accompany the Second Report of the Railway Commissioners, Ireland. H.M.S.O., Dublin.
- ↑ Robinson, Arthur H. (1955). "The 1837 Maps of Henry Drury Harness" (PDF). The Geographical Journal. 121 (4). pp. 440–450.
- ↑ "Dasymetric Mapping and Areal Interpolation: Implementation and Evaluation. - Cartography and Geographic Information Science". Accessmylibrary.com. Retrieved 2011-12-14.
- ↑ http://www.geog.ucsb.edu/~kclarke/G118/Lecture08.html
Further reading
- Petrov, A. "Setting the record straight: On the Russian origins of dasymetric mapping." Cartographica, 2008, 44(2)