California's 32nd congressional district
| California's 32nd congressional district | |
|---|---|
.tif.png) California's 32nd congressional district - since January 3, 2013. | |
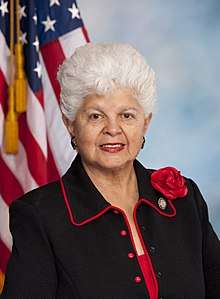
| Current Representative | Grace Napolitano (D–Norwalk) |
| Ethnicity | |
| Cook PVI | D+17[2] |
California's 32nd congressional district is a congressional district in the U.S. state of California based in Los Angeles County. The district includes El Monte, Monterey Park, West Covina, and southern Glendora, in eastern Los Angeles County.
The district is currently represented by Democrat Grace Napolitano.
The district was previously represented by Judy Chu; however, in the 2012 United States elections, due to redistricting, Chu ran for Representative in California's 27th congressional district, while Grace Napolitano ran in the 32nd district, having been displaced from the 38th district.
Voting
| Election results from statewide races | ||
|---|---|---|
| Year | Office | Results |
| 1992 | President | Clinton 78.0 - 12.7% |
| Senator | Boxer 76.5 - 18.1% | |
| Senator | Feinstein 80.5 - 15.1% | |
| 1994 | Governor[3] | Wilson 55.1 - 40.6% |
| Senator[4] | Feinstein 46.7 - 44.8% | |
| 1996 | President | Bill Clinton 75.6% - 24.4% |
| 1998 | Governor[5] | Davis 58.0 - 38.4% |
| Senator[6] | Boxer 53.1 - 43.1% | |
| 2000 | President[7] | Gore 83.4 - 13.0% |
| Senator[8] | Feinstein 81.5 - 11.8% | |
| 2002 | Governor[9] | Davis 59.5 - 31.9% |
| 2003 | Recall[10][11] | Yes 50.2 - 49.8% |
| Schwarzenegger 42.0 - 41.9% | ||
| 2004 | President[12] | Kerry 62.3 - 36.6% |
| Senator[13] | Boxer 68.3 - 26.0% | |
| 2006 | Governor[14] | Schwarzenegger 53.8 - 41.5% |
| Senator[15] | Feinstein 68.1 - 26.7% | |
| 2008 | President[16] | Obama 68.2 - 29.8% |
| 2010 | Governor | Brown 64.6 - 29.1% |
| Senator | Boxer 63.7 - 29.9% | |
| 2012 | President | Obama 65.2 -32.5% |
| 2016 | President | Clinton 66.6 - 27.7% |
List of representatives
| Representative | Party | Dates | Notes | Counties |
|---|---|---|---|---|
| District created | January 3, 1963 | |||
 |
Republican | January 3, 1963 – January 3, 1967 |
Redistricted from 18th district | Los Angeles |
| January 3, 1967 – January 3, 1973 |
Los Angeles, Orange | |||
| January 3, 1973 – December 31, 1974 |
Resigned | Los Angeles | ||
| Vacant | December 31, 1974 – January 3, 1975 |
|||
 |
Democratic | January 3, 1975 – January 3, 1983 |
Redistricted from 35th district | |
| January 3, 1983 – January 3, 1993 |
Retired | Los Angeles (Long Beach) | ||
 |
Democratic | January 3, 1993 – December 8, 2000 |
Redistricted from 28th district Died |
Los Angeles (Culver City) |
| Vacant | December 8, 2000 – June 5, 2001 |
Special election held June 5, 2001 | ||
 |
Democratic | June 5, 2001 – January 3, 2003 |
Redistricted to 33rd district | |
 |
Democratic | January 3, 2003 – February 24, 2009 |
Redistricted from 31st district Resigned to become U.S. Secretary of Labor |
Los Angeles (Baldwin Park, Covina) |
| Vacant | February 24, 2009 – July 14, 2009 |
Special election held July 14, 2009 | ||
 |
Democratic | July 14, 2009 - January 3, 2013 |
Elected in special election Redistricted to the 27th district | |
 |
Democratic | January 3, 2013 - present |
Redistricted from the 38th district | San Gabriel Valley including El Monte and West Covina |
Election results
|
1962 • 1964 • 1966 • 1968 • 1970 • 1972 • 1974 • 1976 • 1978 • 1980 • 1982 • 1984 • 1986 • 1988 • 1990 • 1992 • 1994 • 1996 • 1998 • 2000 • 2001 (Special) • 2002 • 2004 • 2006 • 2008 • 2009 (Special) • 2010 • 2012 • 2014 • 2016 |
1962
| Party | Candidate | Votes | % | |
|---|---|---|---|---|
| Republican | Craig Hosmer (incumbent) | 115,915 | 70.2 | |
| Democratic | J. J. Johovich | 47,917 | 29.8 | |
| Total votes | 163,832 | 100.0 | ||
| Turnout | ||||
| Republican hold | ||||
1964
| Party | Candidate | Votes | % | |
|---|---|---|---|---|
| Republican | Craig Hosmer (incumbent) | 132,603 | 68.9 | |
| Democratic | Michael Cullen | 59,765 | 31.1 | |
| Total votes | 192,368 | 100.0 | ||
| Turnout | ||||
| Republican hold | ||||
1966
| Party | Candidate | Votes | % | |
|---|---|---|---|---|
| Republican | Craig Hosmer (incumbent) | 139,328 | 80.1 | |
| Democratic | Tracy Odell | 34,609 | 19.9 | |
| Total votes | 173,937 | 100.0 | ||
| Turnout | ||||
| Republican hold | ||||
1968
| Party | Candidate | Votes | % | |
|---|---|---|---|---|
| Republican | Craig Hosmer (incumbent) | 138,494 | 73.8 | |
| Democratic | Arthur J. Gottlieb | 45,308 | 24.1 | |
| American Independent | Richard B. Williams | 3,898 | 2.1 | |
| Total votes | 187,700 | 100.0 | ||
| Turnout | ||||
| Republican hold | ||||
1970
| Party | Candidate | Votes | % | |
|---|---|---|---|---|
| Republican | Craig Hosmer (incumbent) | 119,340 | 71.5 | |
| Democratic | Walter L. Mallonee | 44,278 | 26.5 | |
| Peace and Freedom | John S. Donohue | 3,227 | 2.0 | |
| Total votes | 166,845 | 100.0 | ||
| Turnout | ||||
| Republican hold | ||||
1972
| Party | Candidate | Votes | % | |
|---|---|---|---|---|
| Republican | Craig Hosmer (incumbent) | 147,016 | 65.9 | |
| Democratic | Dennis Murray | 71,394 | 32.0 | |
| Peace and Freedom | John S. Donohue | 4,804 | 2.1 | |
| Total votes | 223,214 | 100.0 | ||
| Turnout | ||||
| Republican hold | ||||
1974
| Party | Candidate | Votes | % | |
|---|---|---|---|---|
| Democratic | Glenn M. Anderson (inc.) | 82,485 | 87.7 | |
| American Independent | Virgil V. Badalich | 8,710 | 9.2 | |
| Peace and Freedom | Frank H. Walker | 2,877 | 3.1 | |
| Total votes | 94,072 | 100.0 | ||
| Turnout | ||||
| Democratic hold | ||||
1976
| Party | Candidate | Votes | % | |
|---|---|---|---|---|
| Democratic | Glenn M. Anderson (inc.) | 92,034 | 72.2 | |
| Republican | Clifford O. Young | 35,394 | 27.8 | |
| Total votes | 127,428 | 100.0 | ||
| Turnout | ||||
| Democratic hold | ||||
1978
| Party | Candidate | Votes | % | |
|---|---|---|---|---|
| Democratic | Glenn M. Anderson (inc.) | 74,004 | 71.4 | |
| Republican | Sonya Mathison | 23,242 | 22.4 | |
| American Independent | Ida Bader | 6,363 | 6.1 | |
| Total votes | 103,609 | 100.0 | ||
| Turnout | ||||
| Democratic hold | ||||
1980
| Party | Candidate | Votes | % | |
|---|---|---|---|---|
| Democratic | Glenn M. Anderson (inc.) | 84,057 | 65.9 | |
| Republican | John R. Adler | 39,260 | 30.8 | |
| Libertarian | Thomas A. Cosgrove | 4,209 | 3.3 | |
| Total votes | 127,526 | 100.0 | ||
| Turnout | ||||
| Democratic hold | ||||
1982
| Party | Candidate | Votes | % | |
|---|---|---|---|---|
| Democratic | Glenn M. Anderson (inc.) | 84,663 | 58.0 | |
| Republican | Brian F. Lungren | 57,863 | 39.6 | |
| Peace and Freedom | Eugene E. Ryle | 3,473 | 2.4 | |
| Total votes | 145,999 | 100.0 | ||
| Turnout | ||||
| Democratic hold | ||||
1984
| Party | Candidate | Votes | % | |
|---|---|---|---|---|
| Democratic | Glenn M. Anderson (inc.) | 102,961 | 60.7 | |
| Republican | Roger E. Fiola | 62,176 | 36.6 | |
| Libertarian | Mark F. Denny | 2,517 | 1.5 | |
| Peace and Freedom | Patrick John McCoy | 2,051 | 1.2 | |
| Total votes | 169,705 | 100.0 | ||
| Turnout | ||||
| Democratic hold | ||||
1986
| Party | Candidate | Votes | % | |
|---|---|---|---|---|
| Democratic | Glenn M. Anderson (inc.) | 90,739 | 68.5 | |
| Republican | Joyce M. Robertson | 39,003 | 29.4 | |
| Peace and Freedom | John S. Donohue | 2,799 | 2.1 | |
| Total votes | 132,541 | 100.0 | ||
| Turnout | ||||
| Democratic hold | ||||
1988
| Party | Candidate | Votes | % | |
|---|---|---|---|---|
| Democratic | Glenn M. Anderson (inc.) | 114,666 | 66.9 | |
| Republican | Sanford W. Kahn | 50,710 | 29.6 | |
| Peace and Freedom | Vikki Murdock | 4,032 | 2.4 | |
| Libertarian | Marc F. Denny | 1,941 | 1.1 | |
| Total votes | 171,349 | 100.0 | ||
| Turnout | ||||
| Democratic hold | ||||
1990
| Party | Candidate | Votes | % | |
|---|---|---|---|---|
| Democratic | Glenn M. Anderson (inc.) | 68,268 | 61.5 | |
| Republican | Sanford W. Kahn | 42,692 | 38.5 | |
| Total votes | 110,960 | |||
| Democratic hold | ||||
1992
| Party | Candidate | Votes | % | |
|---|---|---|---|---|
| Democratic | Julian C. Dixon (incumbent) | 150,644 | 87.2 | |
| Libertarian | Robert G. "Bob" Weber Jr. | 12,834 | 7.2 | |
| Peace and Freedom | William R. Williams II | 9,782 | 5.7 | |
| No party | Leanick-Beltran (write-in) | 2 | 0.0% | |
| Total votes | 173,262 | 100.0 | ||
| Turnout | ||||
| Democratic hold | ||||
1994
| Party | Candidate | Votes | % | |
|---|---|---|---|---|
| Democratic | Julian C. Dixon (incumbent) | 98,017 | 77.60 | |
| Republican | Ernie A. Farhat | 22,190 | 17.57 | |
| Peace and Freedom | John Honigsfeld | 6,099 | 4.83 | |
| Total votes | 126,306 | 100.0 | ||
| Turnout | ||||
| Democratic hold | ||||
1996
| Party | Candidate | Votes | % | |
|---|---|---|---|---|
| Democratic | Julian C. Dixon (incumbent) | 124,712 | 82.4 | |
| Republican | Larry Ardito | 18,768 | 12.4 | |
| Libertarian | Neal Donner | 6,390 | 4.2 | |
| Natural Law | Rashied Jibri | 1,557 | 1.0 | |
| Total votes | 151,427 | 100.0 | ||
| Turnout | ||||
| Democratic hold | ||||
1998
| Party | Candidate | Votes | % | |
|---|---|---|---|---|
| Democratic | Julian C. Dixon (incumbent) | 112,253 | 86.69 | |
| Republican | Laurence Ardito | 14,622 | 11.29 | |
| Libertarian | Velko Milosevich | 2,617 | 2.02 | |
| Total votes | 129,492 | 100.0 | ||
| Turnout | ||||
| Democratic hold | ||||
2000
| Party | Candidate | Votes | % | |
|---|---|---|---|---|
| Democratic | Julian C. Dixon (incumbent) | 137,447 | 83.6 | |
| Republican | Kathy Williamson | 19,924 | 12.2 | |
| Libertarian | Bob Weber | 3,875 | 2.3 | |
| Natural Law | Rashied Jibri | 3,281 | 1.9 | |
| Total votes | 164,527 | 100.0 | ||
| Turnout | ||||
| Democratic hold | ||||
2001 (Special)
| Party | Candidate | Votes | % | |
|---|---|---|---|---|
| Democratic | Diane Watson | 75,584 | 74.82 | |
| Republican | Noel Irwin Hentschel | 20,088 | 19.88 | |
| Green | Donna J. Warren | 3,792 | 3.75 | |
| Reform | Ezola B. Foster | 1,557 | 1.54 | |
| Total votes | 101,021 | 100.00 | ||
| Turnout | ||||
| Democratic hold | ||||
2002
| Party | Candidate | Votes | % | |
|---|---|---|---|---|
| Democratic | Hilda Solis (incumbent) | 58,530 | 68.8 | |
| Republican | Emma E. Fischbeck | 23,366 | 27.5 | |
| Libertarian | Michael "Mick" McGuire | 3,183 | 3.7 | |
| Total votes | 85,079 | 100.0 | ||
| Turnout | ||||
| Democratic hold | ||||
2004
| Party | Candidate | Votes | % | |
|---|---|---|---|---|
| Democratic | Hilda Solis (incumbent) | 119,144 | 85.1 | |
| Libertarian | Leland Faegre | 21,002 | 14.9 | |
| Total votes | 140,146 | 100.0 | ||
| Turnout | ||||
| Democratic hold | ||||
2006
| Party | Candidate | Votes | % | |
|---|---|---|---|---|
| Democratic | Hilda Solis (incumbent) | 76,059 | 83.0 | |
| Libertarian | Leland Faegre | 21,002 | 17.0 | |
| Total votes | 97,061 | 100.0 | ||
| Turnout | ||||
| Democratic hold | ||||
2008
| Party | Candidate | Votes | % | |
|---|---|---|---|---|
| Democratic | Hilda Solis (incumbent) | 130,142 | 99.99 | |
| Independent | Innocent Osunwa (write-in) | 8 | 0.01 | |
| Total votes | 130,150 | 100.00 | ||
| Turnout | 53.65 | |||
| Democratic hold | ||||
2009 (Special)
| Party | Candidate | Votes | % | |
|---|---|---|---|---|
| Democratic | Judy Chu | 16,194 | 61.86 | |
| Republican | Betty Chu | 8,630 | 32.96 | |
| Libertarian | Christopher Agrella | 1,356 | 5.18 | |
| Total votes | 24,942 | 100.00 | ||
| Turnout | 10.18 | |||
| Democratic hold | ||||
2010
| Party | Candidate | Votes | % | |
|---|---|---|---|---|
| Democratic | Judy Chu (incumbent) | 77,759 | 71.04 | |
| Republican | Edward Schmerling | 31,697 | 28.96 | |
| Total votes | 109,456 | 100.00 | ||
| Turnout | ||||
| Democratic hold | ||||
2012
| Party | Candidate | Votes | % | |
|---|---|---|---|---|
| Democratic | Grace Napolitano (incumbent) | 124,903 | 65.7 | |
| Republican | David L. Miller | 65,208 | 34.3 | |
| Total votes | 190,111 | 100.0 | ||
| Democratic hold | ||||
2014
| Party | Candidate | Votes | % | |
|---|---|---|---|---|
| Democratic | Grace Napolitano (incumbent) | 50,353 | 60% | |
| Republican | Arturo Enrique Alas | 34,053 | 40% | |
| Total votes | 84,406 | 100% | ||
| Democratic hold | ||||
2016
| Party | Candidate | Votes | % | |
|---|---|---|---|---|
| Democratic | Grace Napolitano (incumbent) | 114,926 | 62% | |
| Democratic | Roger Hernández | 71,720 | 38% | |
| Total votes | 186,464 | 100% | ||
| Democratic hold | ||||
Living former Members
As of April 2015, there are three former members of the U.S. House of Representatives from California's 32nd congressional district that are currently living.
| Representative | Term in office | Date of birth (and age) |
|---|---|---|
| Diane Watson | 2001 - 2003 | November 12, 1933 |
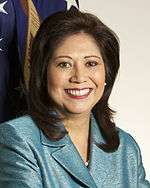
| Hilda Solis | 2003 - 2009 | October 20, 1957 |
| Judy Chu | 2009 - 2013 | July 7, 1953 |
Historical district boundaries

See also
References
- ↑ "California's citizen commission final district maps: Find out what's changed where you live". Latimes.com. Retrieved 21 May 2018.
- ↑ "Partisan Voting Index – Districts of the 115th Congress" (PDF). The Cook Political Report. April 7, 2017. Retrieved April 7, 2017.
- ↑ Statement of Vote (1994 Elections) Archived May 20, 2011, at the Wayback Machine.
- ↑ Statement of Vote (1994 Election) Archived May 20, 2011, at the Wayback Machine.
- ↑ Statement of Vote (1998 Governor) Archived November 9, 2010, at the Wayback Machine.
- ↑ "Statement of Vote (1998 Senator)". Vote98.sos.ca.gov. Archived from the original on 2010-11-10. Retrieved 21 May 2018.
- ↑ Statement of Vote (2000 President) Archived 2011-05-20 at the Wayback Machine.
- ↑ Statement of Vote (2000 Senator) Archived 2011-05-20 at the Wayback Machine.
- ↑ Statement of Vote (2002 Governor) Archived 2010-11-11 at the Wayback Machine.
- ↑ Statement of Vote (2003 Recall Question) Archived 2011-05-20 at the Wayback Machine.
- ↑ Statement of Vote (2003 Governor) Archived 2011-05-20 at the Wayback Machine.
- ↑ Statement of Vote (2004 President) Archived 2011-05-20 at the Wayback Machine.
- ↑ Statement of Vote (2004 Senator) Archived 2011-08-10 at the Wayback Machine.
- ↑ Statement of Vote (2006 Governor) Archived 2011-08-10 at the Wayback Machine.
- ↑ Statement of Vote (2006 Senator) Archived 2011-08-10 at the Wayback Machine.
- ↑ (2008 President) Archived 2009-02-11 at the Wayback Machine.
- ↑ "1962 election results" (PDF). Clerk.house.gov. Retrieved 21 May 2018.
- ↑ "1964 election results" (PDF). Clerk.house.gov. Retrieved 21 May 2018.
- ↑ "1966 election results" (PDF). Clerk.house.gov. Retrieved 21 May 2018.
- ↑ "1968 election results" (PDF). Clerk.house.gov. Retrieved 21 May 2018.
- ↑ "1970 election results" (PDF). Clerk.house.gov. Retrieved 21 May 2018.
- ↑ "1972 election results" (PDF). Clerk.house.gov. Retrieved 21 May 2018.
- ↑ "1974 election results" (PDF). Clerk.house.gov. Retrieved 21 May 2018.
- ↑ "1976 election results" (PDF). Clerk.house.gov. Retrieved 21 May 2018.
- ↑ "1978 election results" (PDF). Clerk.house.gov. Retrieved 21 May 2018.
- ↑ "1980 election results" (PDF). Clerk.house.gov. Retrieved 21 May 2018.
- ↑ "1982 election results" (PDF). Clerk.house.gov. Retrieved 21 May 2018.
- ↑ "1984 election results" (PDF). Clerk.house.gov. Retrieved 21 May 2018.
- ↑ "1986 election results" (PDF). Clerk.house.gov. Retrieved 21 May 2018.
- ↑ "1988 election results" (PDF). Clerk.house.gov. Retrieved 21 May 2018.
- ↑ "1990 election results" (PDF). Clerk.house.gov. Retrieved 21 May 2018.
- ↑ "1992 election results" (PDF). Clerk.house.gov. Retrieved 21 May 2018.
- ↑ "1994 election results" (PDF). Clerk.house.gov. Retrieved 21 May 2018.
- ↑ "1996 election results" (PDF). Clerk.house.gov. Retrieved 21 May 2018.
- ↑ "1998 election results" (PDF). Clerk.house.gov. Retrieved 21 May 2018.
- ↑ "2000 election results" (PDF). Clerk.house.gov. Retrieved 21 May 2018.
- ↑ "JoinCalifornia - 06-05-2001 Election". Joincalifornia.com. Retrieved 21 May 2018.
- ↑ 2002 general election results Archived February 3, 2009, at the Wayback Machine.
- ↑ 2004 general election results
- ↑ 2006 general election results Archived November 27, 2008, at the Wayback Machine.
- ↑ 2006 general election results Archived 2008-11-27 at the Wayback Machine.
- ↑ "Semi-Final Official Election Returns". Los Angeles County Registrar-Recorder/County Clerk. 2009-07-14. Retrieved 2009-07-14.
- ↑ 2010 general election results Archived 2008-11-27 at the Wayback Machine.
- 1 2 2012 general election results Archived October 19, 2013, at the Wayback Machine.
External links
- GovTrack.us: California's 32nd congressional district
- RAND California Election Returns: District Definitions
- California Voter Foundation map - CD32
Coordinates: 34°05′22″N 117°54′50″W / 34.08944°N 117.91389°W