California's 28th congressional district
| California's 28th congressional district | |
|---|---|
.tif.png) California's 28th congressional district - since January 3, 2013. | |
| Current Representative | Adam Schiff (D–Burbank) |
| Ethnicity | |
| Cook PVI | D+23[2] |
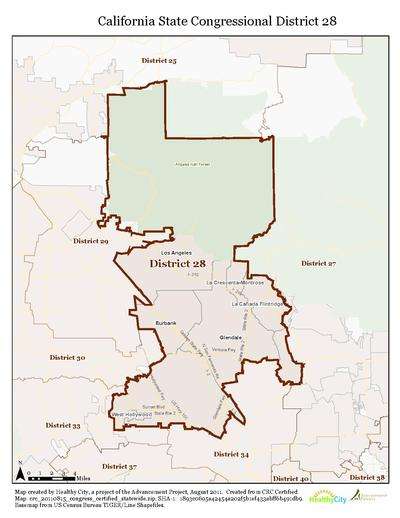
California's 28th congressional district is a congressional district in the U.S. state of California, in Los Angeles County. The district is currently represented by Democrat Adam Schiff.
The district includes Burbank, parts of Pasadena Glendale, the Verdugo Hills communities of Sunland and Tujunga, West Hollywood as well as parts of central Los Angeles including Hollywood, the Hollywood Hills, Echo Park, Silver Lake, and Los Feliz. As it includes Glendale and Little Armenia, it has the largest Armenian-American population of any district in the country (Schiff cites the Armenian population at greater than 70,000).[3][4]
Formerly, from 2003 to 2013, the district included about half of the San Fernando Valley, including North Hollywood, in the Greater Los Angeles Area.
Voting
| Election results from statewide races | ||
|---|---|---|
| Year | Office | Results |
| 2016 | President | Clinton 72.1 – 22.3% |
| 2012 | President | Obama 70.3 – 26.5% |
| 2010 | Governor | Brown 69.3 – 25.7% |
| Senator | Boxer 69.8 – 25.1% | |
| 2008 | President[5] | Obama 76.1 – 22.0% |
| 2006 | Governor[6] | Angelides 54.7 – 40.2% |
| Senator[7] | Feinstein 75.2 – 19.5% | |
| 2004 | President[8] | Kerry 71.0 – 27.9% |
| Senator[9] | Boxer 73.9 – 20.8% | |
| 2003 | Recall[10][11] | No 58.0 – 42.0% |
| Bustamante 44.7 – 39.1% | ||
| 2002 | Governor[12] | Davis 62.2 – 27.9% |
| 2000 | President[13] | Gore 49.0 – 46.9% |
| Senator[14] | Feinstein 51.2 – 42.0% | |
| 1998 | Governor | |
| Senator | ||
| 1996 | President | |
| 1994 | Governor | |
| Senator | ||
| 1992 | President | Bush 41.3 – 37.8% |
| Senator | Herschensohn 54.8 – 36.9% | |
| Senator | Seymour 46.9 – 44.8% | |
List of representatives
| Representative | Party | Dates | Notes | Counties |
|---|---|---|---|---|
| District created | January 3, 1953 | |||
 |
Republican | January 3, 1953 – January 3, 1963 | Redistricted to the 35th district | Orange, northwestern San Diego |
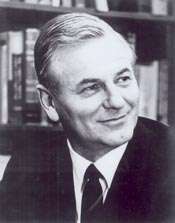 |
Republican | January 3, 1963 – January 3, 1975 | Redistricted from the 16th district Redistricted to the 27th district |
Los Angeles |
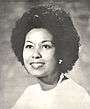 |
Democratic | January 3, 1975 – January 3, 1979 | Redistricted from the 37th district Retired to run for attorney general | |
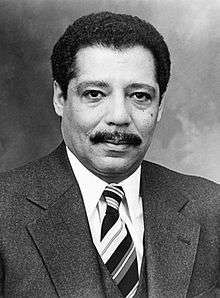 |
Democratic | January 3, 1979 – January 3, 1983 | ||
| January 3, 1983 – January 3, 1993 | Redistricted to the 32nd district | Southern Los Angeles (Inglewood) | ||
 |
Republican | January 3, 1993 – January 3, 2003 | Redistricted from the 33rd district Redistricted to the 26th district |
Los Angeles (eastern suburbs) |
 |
Democratic | January 3, 2003 – January 3, 2013 | Redistricted from the 26th district Redistricted to the 30th district and lost |
Los Angeles (San Fernando, Van Nuys) |
.jpg) |
Democratic | January 3, 2013 – present | Redistricted from the 29th district | Burbank, Glendale, northern Los Angeles suburbs, as well as parts of central Los Angeles |
Election results
|
1952 • 1954 • 1956 • 1958 • 1960 • 1962 • 1964 • 1966 • 1968 • 1970 • 1972 • 1974 • 1976 • 1978 • 1980 • 1982 • 1984 • 1986 • 1988 • 1990 • 1992 • 1994 • 1996 • 1998 • 2000 • 2002 • 2004 • 2006 • 2008 • 2012 • 2014 • 2016 |
1952
| Party | Candidate | Votes | % | ||
|---|---|---|---|---|---|
| Republican | James B. Utt | 106,972 | 63.0 | ||
| Democratic | Lionel Van Deerlin | 62,779 | 37.0 | ||
| Total votes | 169,751 | 100.0 | |||
| Turnout | |||||
| Republican win (new seat) | |||||
1954
| Party | Candidate | Votes | % | |
|---|---|---|---|---|
| Republican | James B. Utt (incumbent) | 95,680 | 66.2 | |
| Democratic | Harriet Enderle | 48,785 | 33.8 | |
| Total votes | 144,465 | 100.0 | ||
| Turnout | ||||
| Republican hold | ||||
1956
| Party | Candidate | Votes | % | |
|---|---|---|---|---|
| Republican | James B. Utt (incumbent) | 159,456 | 64.5 | |
| Democratic | Gordon T. Shepard | 87,691 | 35.5 | |
| Total votes | 247,147 | 100.0 | ||
| Turnout | ||||
| Republican hold | ||||
1958
| Party | Candidate | Votes | % | |
|---|---|---|---|---|
| Republican | James B. Utt (incumbent) | 152,855 | 58.2 | |
| Democratic | T. R. Boyett | 109,794 | 41.8 | |
| Total votes | 262,649 | 100.0 | ||
| Turnout | ||||
| Republican hold | ||||
1960
| Party | Candidate | Votes | % | |
|---|---|---|---|---|
| Republican | James B. Utt (incumbent) | 241,765 | 60.9 | |
| Democratic | Max E. Woods | 155,221 | 39.1 | |
| Total votes | 396,986 | 100.0 | ||
| Turnout | ||||
| Republican hold | ||||
1962
| Party | Candidate | Votes | % | |
|---|---|---|---|---|
| Republican | Alphonzo E. Bell, Jr. (inc.) | 162,233 | 64 | |
| Democratic | Jerry Pacht | 91,305 | 36 | |
| Total votes | 253,538 | 100.0 | ||
| Turnout | ||||
| Republican hold | ||||
1964
| Party | Candidate | Votes | % | |
|---|---|---|---|---|
| Republican | Alphonzo E. Bell, Jr. (inc.) | 205,473 | 65.6 | |
| Democratic | Gerald A. Gottlieb | 107,852 | 34.4 | |
| Total votes | 313,325 | 100.0 | ||
| Turnout | ||||
| Republican hold | ||||
1966
| Party | Candidate | Votes | % | |
|---|---|---|---|---|
| Republican | Alphonzo E. Bell, Jr. (inc.) | 211,404 | 72.3 | |
| Democratic | Lawrence "Lorry" Sherman | 81,007 | 27.7 | |
| Total votes | 292,411 | 100.0 | ||
| Turnout | ||||
| Republican hold | ||||
1968
| Party | Candidate | Votes | % | |
|---|---|---|---|---|
| Republican | Alphonzo E. Bell, Jr. (inc.) | 168,208 | 71.2 | |
| Democratic | John McKee Pratt | 63,414 | 26.9 | |
| Peace and Freedom | Sherman Pearl | 4,503 | 1.9 | |
| Total votes | 236,125 | 100.0 | ||
| Turnout | ||||
| Republican hold | ||||
1970
| Party | Candidate | Votes | % | |
|---|---|---|---|---|
| Republican | Alphonzo E. Bell, Jr. (inc.) | 154,691 | 69.3 | |
| Democratic | Don McLaughlin | 57,882 | 25.9 | |
| American Independent | Derek A. Gordon | 5,759 | 2.6 | |
| Peace and Freedom | Jane E. Gordon | 4,971 | 2.2 | |
| Total votes | 223,303 | 100.0 | ||
| Turnout | ||||
| Republican hold | ||||
1972
| Party | Candidate | Votes | % | |
|---|---|---|---|---|
| Republican | Alphonzo E. Bell, Jr. (inc.) | 142,102 | 60.7 | |
| Democratic | Michael Shapiro | 87,783 | 37.5 | |
| Peace and Freedom | Jack Hampton | 4,184 | 1.8 | |
| Total votes | 234,069 | 100.0 | ||
| Turnout | ||||
| Republican hold | ||||
1974
| Party | Candidate | Votes | % | |
|---|---|---|---|---|
| Democratic | Yvonne Brathwaite Burke (I) | 86,743 | 80.1 | |
| Republican | Tom Neddy | 21,308 | 19.9 | |
| Total votes | 108,051 | 100.0 | ||
| Turnout | ||||
| Democratic hold | ||||
1976
| Party | Candidate | Votes | % | |
|---|---|---|---|---|
| Democratic | Yvonne Brathwaite Burke (I) | 114,612 | 80.2 | |
| Republican | Edward S. Skinner | 28,303 | 19.8 | |
| Total votes | 142,915 | 100.0 | ||
| Turnout | ||||
| Democratic hold | ||||
1978
| Party | Candidate | Votes | % | |
|---|---|---|---|---|
| Democratic | Julian C. Dixon | 97,592 | 100.0 | |
| Turnout | ||||
| Democratic hold | ||||
1980
| Party | Candidate | Votes | % | |
|---|---|---|---|---|
| Democratic | Julian C. Dixon (incumbent) | 108,725 | 79.2 | |
| Republican | Robert Reid | 23,179 | 16.9 | |
| Libertarian | Ernst F. Ghermann | 5,400 | 3.9 | |
| Total votes | 137,304 | 100.0 | ||
| Turnout | ||||
| Democratic hold | ||||
1982
| Party | Candidate | Votes | % | |
|---|---|---|---|---|
| Democratic | Julian C. Dixon (incumbent) | 103,469 | 78.9 | |
| Republican | David Goerz | 24,473 | 18.7 | |
| Libertarian | David W. Meleney | 3,210 | 2.4 | |
| Total votes | 131,152 | 100.0 | ||
| Turnout | ||||
| Democratic hold | ||||
1984
| Party | Candidate | Votes | % | |
|---|---|---|---|---|
| Democratic | Julian C. Dixon (incumbent) | 113,076 | 75.6 | |
| Republican | Beatrice M. Jett | 33,511 | 22.4 | |
| Libertarian | Don Swemgimurti Federick | 2,930 | 2.0 | |
| Total votes | 149,517 | 100.0 | ||
| Turnout | ||||
| Democratic hold | ||||
1986
| Party | Candidate | Votes | % | |
|---|---|---|---|---|
| Democratic | Julian C. Dixon (incumbent) | 92,635 | 76.3 | |
| Republican | George Zaldivar Adams | 25,858 | 21.3 | |
| Libertarian | Howard Johnson | 2,837 | 2.3 | |
| Total votes | 121,330 | 100.0 | ||
| Turnout | ||||
| Democratic hold | ||||
1988
| Party | Candidate | Votes | % | |
|---|---|---|---|---|
| Democratic | Julian C. Dixon (incumbent) | 109,801 | 76.1 | |
| Republican | George Zaldivar Adams | 28,645 | 19.8 | |
| Libertarian | Howard Johnson | 3,080 | 2.1 | |
| Peace and Freedom | Salomea Honigsfeld | 2,811 | 1.9 | |
| Total votes | 144,337 | 100.0 | ||
| Turnout | ||||
| Democratic hold | ||||
1990
| Party | Candidate | Votes | % | |
|---|---|---|---|---|
| Democratic | Julian C. Dixon (incumbent) | 69,482 | 72.7 | |
| Republican | George Zaldivar Adams | 21,245 | 22.2 | |
| Peace and Freedom | William R. Williams II | 2,723 | 2.8 | |
| Libertarian | Robert G. "Bob" Weber Jr. | 2,150 | 2.2 | |
| Total votes | 95,600 | 100.0 | ||
| Turnout | ||||
| Democratic hold | ||||
1992
| Party | Candidate | Votes | % | |
|---|---|---|---|---|
| Republican | David Dreier (incumbent) | 122,353 | 58.4 | |
| Democratic | Al Wachtel | 76,525 | 36.6 | |
| Green | Walt Contreras Sheasby | 6,233 | 3.0 | |
| Libertarian | Thomas J. Dominy | 4,271 | 2.0 | |
| Total votes | 209,382 | 100.0 | ||
| Turnout | ||||
| Republican hold | ||||
1994
| Party | Candidate | Votes | % | |
|---|---|---|---|---|
| Republican | David Dreier (incumbent) | 110,179 | 67.07 | |
| Democratic | Tommy Randle | 50,022 | 30.45 | |
| Libertarian | Jorj Clayton Baker | 4,069 | 2.48 | |
| No party | Hatch (write-in) | 7 | 0.00% | |
| Total votes | 164,277 | 100.0 | ||
| Turnout | ||||
| Republican hold | ||||
1996
| Party | Candidate | Votes | % | |
|---|---|---|---|---|
| Republican | David Dreier (incumbent) | 113,389 | 60.7 | |
| Democratic | David Levering | 69,037 | 37.0 | |
| Libertarian | Ken Saurenman | 4,459 | 2.3 | |
| Total votes | 186,885 | 100.0 | ||
| Turnout | ||||
| Republican hold | ||||
1998
| Party | Candidate | Votes | % | |
|---|---|---|---|---|
| Republican | David Dreier (incumbent) | 90,607 | 57.64 | |
| Democratic | Janice M. Nelson | 61,721 | 39.26 | |
| Libertarian | Jerry R. Douglas | 2,099 | 1.34 | |
| Green | Walt Contreras Sheasby | 1,954 | 1.24 | |
| Natural Law | M. Lawrence Allison | 819 | 0.52 | |
| Total votes | 157,200 | 100.0 | ||
| Turnout | ||||
| Republican hold | ||||
2000
| Party | Candidate | Votes | % | |
|---|---|---|---|---|
| Republican | David Dreier (incumbent) | 116,557 | 56.9 | |
| Democratic | Janice M. Nelson | 81,804 | 39.9 | |
| Libertarian | Randall G. Weissbuch | 2,823 | 1.3 | |
| Natural Law | Lawrence Allison | 2,083 | 1.0 | |
| American Independent | Joe "Jay" Haytas | 1,932 | 0.9 | |
| Total votes | 205,199 | 100.0 | ||
| Turnout | ||||
| Republican hold | ||||
2002
| Party | Candidate | Votes | % | |
|---|---|---|---|---|
| Democratic | Howard Berman (incumbent) | 73,771 | 71.4 | |
| Republican | David R. Hernandez, Jr. | 23,926 | 23.2 | |
| Libertarian | Kelley L. Ross | 5,629 | 5.4 | |
| Total votes | 113,326 | 100.0 | ||
| Turnout | ||||
| Democratic hold | ||||
2004
| Party | Candidate | Votes | % | |
|---|---|---|---|---|
| Democratic | Howard Berman (incumbent) | 115,303 | 71.0 | |
| Republican | David Hernandez | 37,868 | 23.3 | |
| Libertarian | Kelley L. Ross | 9,339 | 5.7 | |
| Total votes | 162,410 | 100.0 | ||
| Turnout | ||||
| Democratic hold | ||||
2006
| Party | Candidate | Votes | % | |
|---|---|---|---|---|
| Democratic | Howard Berman (incumbent) | 79,866 | 74.0 | |
| Republican | Stanley Kimmel Kesselman | 20,629 | 19.1 | |
| Green | Byron De Lear | 3,868 | 3.5 | |
| Libertarian | Kelley L. Ross | 3,679 | 3.4 | |
| Total votes | 108,042 | 100.0 | ||
| Turnout | ||||
| Democratic hold | ||||
2008
| Party | Candidate | Votes | % | |
|---|---|---|---|---|
| Democratic | Howard Berman (incumbent) | 137,471 | 100.00 | |
| Total votes | 137,471 | 100.0 | ||
| Turnout | ||||
| Democratic hold | ||||
2010
| Party | Candidate | Votes | % | |
|---|---|---|---|---|
| Democratic | Howard Berman (incumbent) | 88,385 | 69.54 | |
| Republican | Merlin Froyd | 28,493 | 22.42 | |
| Libertarian | Carlos A. Rodriguez | 10,229 | 8.04 | |
| Total votes | 127,107 | 100.00 | ||
| Turnout | ||||
| Democratic hold | ||||
2012
| Party | Candidate | Votes | % | |
|---|---|---|---|---|
| Democratic | Adam Schiff (incumbent) | 188,703 | 76.5 | |
| Republican | Phil Jennerjahn | 58,008 | 23.5 | |
| Total votes | 246,711 | 100.00 | ||
| Turnout | ||||
| Democratic hold | ||||
2014
| Party | Candidate | Votes | % | |
|---|---|---|---|---|
| Democratic | Adam Schiff (incumbent) | 91,996 | 77% | |
| No party preference | Steve Stokes | 28,268 | 23% | |
| Total votes | 120,264 | 100% | ||
| Turnout | ||||
| Democratic hold | ||||
2016
| Party | Candidate | Votes | % | |
|---|---|---|---|---|
| Democratic | Adam Schiff (incumbent) | 210,883 | 78% | |
| Republican | Lenore Solis | 59,526 | 22% | |
| Total votes | 270,409 | 100% | ||
| Turnout | ||||
| Democratic hold | ||||
Living former Members
As of April 2015, there are three former members of the U.S. House of Representatives from California's 28th congressional district that are currently living.
| Representative | Term in office | Date of birth (and age) |
|---|---|---|
| Yvonne Brathwaite Burke | 1975 - 1979 | October 26, 1932 |
| David Dreier | 1993 - 2003 | July 5, 1952 |
| Howard Berman | 2003 - 2013 | April 15, 1941 |
Historical district boundaries

See also
References
- ↑ "California's citizen commission final district maps: Find out what's changed where you live". latimes.com.
- ↑ "Partisan Voting Index – Districts of the 115th Congress" (PDF). The Cook Political Report. April 7, 2017. Retrieved April 7, 2017.
- ↑ Washington Post: "Worse than irrelevant: A congressional resolution about massacres in Turkey 90 years ago endangers present-day U.S. security", p. A16, October 10, 2007
- ↑ Wall Street Journal: "Political History", Review & Outlook, October 2, 2007
- ↑ (2008 President) Archived February 14, 2009, at the Wayback Machine.
- ↑ Statement of Vote (2006 Governor) Archived August 10, 2011, at the Wayback Machine.
- ↑ Statement of Vote (2006 Senator) Archived August 10, 2011, at the Wayback Machine.
- ↑ Statement of Vote (2004 President) Archived May 20, 2011, at the Wayback Machine.
- ↑ Statement of Vote (2004 Senator) Archived August 10, 2011, at the Wayback Machine.
- ↑ Statement of Vote (2003 Recall Question) Archived May 20, 2011, at the Wayback Machine.
- ↑ Statement of Vote (2003 Governor) Archived May 20, 2011, at the Wayback Machine.
- ↑ Statement of Vote (2002 Governor) Archived November 11, 2010, at the Wayback Machine.
- ↑ Statement of Vote (2000 President) Archived May 20, 2011, at the Wayback Machine.
- ↑ Statement of Vote (2000 Senator) Archived May 20, 2011, at the Wayback Machine.
- ↑ "1952 election results" (PDF).
- ↑ "1954 election results" (PDF).
- ↑ "1956 election results" (PDF).
- ↑ "1958 election results" (PDF).
- ↑ "1960 election results" (PDF).
- ↑ "1962 election results" (PDF).
- ↑ "1964 election results" (PDF).
- ↑ "1966 election results" (PDF).
- ↑ "1968 election results" (PDF).
- ↑ "1970 election results" (PDF).
- ↑ "1972 election results" (PDF).
- ↑ "1974 election results" (PDF).
- ↑ "1976 election results" (PDF).
- ↑ "1978 election results" (PDF).
- ↑ "1980 election results" (PDF).
- ↑ "1982 election results" (PDF).
- ↑ "1984 election results" (PDF).
- ↑ "1986 election results" (PDF).
- ↑ "1988 election results" (PDF).
- ↑ "1990 election results" (PDF).
- ↑ "1992 election results" (PDF).
- ↑ "1994 election results" (PDF).
- ↑ "1996 election results" (PDF).
- ↑ "1998 election results" (PDF).
- ↑ "2000 election results" (PDF).
- ↑ 2002 general election results Archived February 3, 2009, at the Wayback Machine.
- ↑ 2004 general election results
- ↑ 2006 general election results Archived November 27, 2008, at the Wayback Machine.
- ↑ 2008 general election results
- ↑ 2010 general election results
- 1 2 "Archived copy" (PDF). Archived from the original (PDF) on December 24, 2012. Retrieved 2014-10-16.
External links
- GovTrack.us: California's 28th congressional district
- RAND California Election Returns: District Definitions
- California Voter Foundation map – CD28
Coordinates: 34°15′00″N 118°17′29″W / 34.25000°N 118.29139°W