Belfast East (Assembly constituency)
| Belfast East | |
|---|---|
|
Northern Ireland Assembly Parliamentary Constituency | |
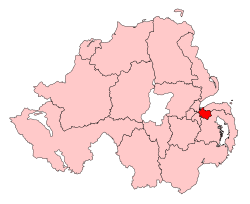 East Belfast shown within Northern Ireland | |
| Current constituency | |
| Created | 1973 |
| Seats |
6 (1998–2016) 5 (2017–) |
| MLAs |
|
| City council | Belfast City Council |
| EP constituency | Northern Ireland |
Belfast East (Irish: Béal Feirste Thoir, Ulster Scots: Bilfawst East) is a constituency in the Northern Ireland Assembly.
The seat was first used for a Northern Ireland-only election for the Northern Ireland Assembly, 1973. It usually shares boundaries with the Belfast East UK Parliament constituency, however the boundaries of the two constituencies were slightly different from 1983 to 1986 and 2010 to 2011 as the Assembly boundaries had not caught up with Parliamentary boundary changes and from 1996 to 1997 when members of the Northern Ireland Forum had been elected from the newly drawn Parliamentary constituencies but the 51st Parliament of the United Kingdom, elected in 1992 under the 1983–95 constituency boundaries, was still in session.
Members were then elected from the constituency to the 1975 Constitutional Convention, the 1982 Assembly, the 1996 Forum and then to the current Assembly from 1998.
For further details of the history and boundaries of the constituency, see Belfast East (UK Parliament constituency).
Members
| Election | MLA (Party) |
MLA (Party) |
MLA (Party) |
MLA (Party) |
MLA (Party) |
MLA (Party) | ||||||
|---|---|---|---|---|---|---|---|---|---|---|---|---|
| 1973 | Oliver Napier (Alliance Party) |
David Bleakley (Labour) |
Joshua Cardwell (UUP/UPNI) |
Norman Agnew (UUP) |
Roy Bradford (UUP) |
Eileen Paisley (DUP) | ||||||
| 1975 | Reg Empey (Vanguard) |
William Craig (Vanguard) | ||||||||||
| 1982 | Addie Morrow (Alliance Party) |
Dorothy Dunlop (UUP) |
Jeremy Burchill (UUP) |
Denny Vitty (DUP) |
Peter Robinson (DUP) | |||||||
| 1996 | John Alderdice (Alliance Party) |
5 seats 1996-1998 |
Reg Empey (UUP) |
Jim Rodgers (UUP) |
Sammy Wilson (DUP) | |||||||
| 1998 | David Ervine (PUP) |
Ian Adamson (UUP) | ||||||||||
| 2003 | Naomi Long (Alliance Party) |
Michael Copeland (UUP) |
Robin Newton (DUP) | |||||||||
| January 2007 co-option |
Dawn Purvis (PUP) | |||||||||||
| 2007 | Wallace Browne (DUP) | |||||||||||
| July 2010 co-option |
Chris Lyttle (Alliance Party) | |||||||||||
| 2011 | Judith Cochrane (Alliance Party) |
Michael Copeland (UUP) |
Sammy Douglas (DUP) | |||||||||
| September 2015 co-option |
Andy Allen (UUP) | |||||||||||
| 2016 | Naomi Long (Alliance Party) |
Joanne Bunting (DUP) | ||||||||||
| 2017 | 5 seats 2017-present | |||||||||||
Note: The columns in this table are used only for presentational purposes, and no significance should be attached to the order of columns. For details of the order in which seats were won at each election, see the detailed results of that election.
Elections
Northern Ireland Assembly
2017
| 2017 Assembly election: Belfast East – 5 Seats[1] | ||||||||||||||
|---|---|---|---|---|---|---|---|---|---|---|---|---|---|---|
| Party | Candidate | % 1st Pref | Count 1 | Count 2 | Count 3 | Count 4 | Count 5 | Count 6 | Count 7 | Count 8 | Count 9 | Count 10 | Count 11 | |
| Alliance | Naomi Long | 18.9 | 7,610 | |||||||||||
| Alliance | Chris Lyttle | 12.5 | 5,059 | 5,760.03 | 5,780.25 | 5,885.86 | 6,032.81 | 6,072.14 | 6,367.87 | 7,268.87 | ||||
| UUP | Andy Allen | 13.1 | 5,275 | 5,313.17 | 5,323.39 | 5,356.60 | 5,498.59 | 5,767.92 | 5,783.14 | 6,048.62 | 7,257.62 | |||
| DUP | Joanne Bunting | 14.9 | 6,007 | 6,016.02 | 6,021.02 | 6,026.13 | 6,057.35 | 6,217.46 | 6,228.46 | 6,275.01 | 6,759.01 | |||
| DUP | Robin Newton | 11.7 | 4,729 | 4,734.50 | 4,736.50 | 4,739.50 | 4,774.50 | 4,862.61 | 4,865.61 | 4,890.72 | 5,268.26 | 5,333.26 | 5,541.65 | |
| DUP | David Douglas | 11.0 | 4,431 | 4435.18 | 4436.18 | 4,440.18 | 4,455.40 | 4,568.40 | 4,572.40 | 4,599.73 | 4,995.25 | 5,093.25 | 5,410.84 | |
| PUP | John Kyle | 6.6 | 2,658 | 2,673.29 | 2,678.51 | 2,685.73 | 2,751.95 | 2,936.28 | 2,950.28 | 3,148.79 | ||||
| Green (NI) | Georgina Milne | 3.6 | 1,447 | 1,474.06 | 1,500.28 | 1,539.49 | 1,763.36 | 1,801.58 | 2,080.65 | |||||
| Sinn Féin | Mairéad O'Donnell | 2.9 | 1,173 | 1,183.34 | 1,185.45 | 1,216.66 | 1,232.88 | 1,235.10 | ||||||
| TUV | Andrew Girvin | 2.3 | 917 | 918.65 | 920.65 | 924.76 | 958.87 | |||||||
| Labour Alternative | Courtney Robinson | 1.1 | 442 | 449.48 | 456.48 | 467.81 | ||||||||
| NI Conservatives | Sheila Bodel | 0.7 | 275 | 276.32 | 278.43 | 280.43 | ||||||||
| SDLP | Séamas de Faoite | 0.6 | 250 | 260.45 | 260.56 | |||||||||
| Independent | Jordy McKeag | 84 | 84 | 85.43 | ||||||||||
| Electorate: 64,788 Valid: 40,828 Spoilt: 471 (1.15%) Quota: 6,727 Turnout: 40,828 (63.02%) | ||||||||||||||
2016
| 2016 Assembly election: Belfast East – 6 Seats[2] | ||||||||||||||||
|---|---|---|---|---|---|---|---|---|---|---|---|---|---|---|---|---|
| Party | Candidate | % 1st Pref | Count 1 | Count 2 | Count 3 | Count 4 | Count 5 | Count 6 | Count 7 | Count 8 | Count 9 | Count 10 | Count 11 | Count 12 | Count 13 | |
| DUP | Joanne Bunting | 14.9 | 5,538 | |||||||||||||
| Alliance | Naomi Long | 14.7 | 5,482 | |||||||||||||
| DUP | Sammy Douglas | 11.4 | 4,230 | 4,401.52 | 4,409 | 4,411.19 | 4,436.26 | 4,456.29 | 4,572.61 | 4,574.61 | 4,756.52 | 4,978.16 | 5,045.16 | 5,461.16 | ||
| UUP | Andy Allen | 8.2 | 3,047 | 3,057.28 | 3,065.28 | 3,069.57 | 3,176.72 | 3,201.81 | 3,283.15 | 3,286.15 | 3,520.59 | 3,777.94 | 4,756.53 | 5,332.53 | ||
| Alliance | Chris Lyttle | 7.5 | 2,805 | 2,805.92 | 2,858.92 | 2,975.71 | 3,033.23 | 3,109.04 | 3,127.19 | 3,231.58 | 3,252.64 | 3,279.82 | 3,318.36 | 3,500.90 | 5,685.90 | |
| DUP | Robin Newton | 10.4 | 3,875 | 3,896.88 | 3,900.04 | 3,902.50 | 3,938.62 | 3,946.62 | 3,995.82 | 3,998.85 | 4,105.28 | 4,182.55 | 4,267.83 | 4,745.50 | 4,812.54 | |
| Green (NI) | Ross Brown | 5.9 | 2,183 | 2,184.40 | 2,222.40 | 2,233.29 | 2,283.49 | 2,497.23 | 2,559.32 | 2,893.95 | 2,935.15 | 3,018.46 | 3,050.84 | 3,293.25 | 3,487.69 | |
| Alliance | Tim Morrow | 6.4 | 2,372 | 2,372.36 | 2,390.36 | 2,404.97 | 2,431.07 | 2,469.25 | 2,478.41 | 2,526.56 | 2,533.56 | 2,538.56 | 2,568.07 | 2,636.62 | ||
| PUP | John Kyle | 4.8 | 1,772 | 1,776 | 1,786.04 | 1,788.65 | 1,788.71 | 1,816.77 | 1,928.95 | 1,938.95 | 2,082.30 | 2,485.62 | 2,533.87 | |||
| UUP | Chris McGimpsey | 2.9 | 1,095 | 1,098.24 | 1,102.24 | 1,104.67 | 1,165.73 | 1,178.77 | 1,211.87 | 1,214.87 | 1,305.13 | 1,346.15 | ||||
| Independent | Maggie Hutton | 3.0 | 1,099 | 1,100.48 | 1,107.48 | 1,108.26 | 1,113.26 | 1,144.39 | 1,190.57 | 1,192.60 | 1,277.76 | |||||
| TUV | Andrew Girvin | 2.4 | 887 | 889.72 | 891.72 | 891.99 | 907.03 | 911.03 | 1,037.14 | 1,037.14 | ||||||
| Sinn Féin | Niall Ó Donnghaile | 2.5 | 946 | 946 | 963 | 964.71 | 966.71 | 985.77 | 988.77 | |||||||
| UKIP | Jonny Lavery | 1.7 | 631 | 632.52 | 634.52 | 635.15 | 694.15 | 717.19 | ||||||||
| Labour Alternative | Courtney Robinson | 1.4 | 517 | 517.2 | 546.2 | 548.57 | 556.57 | |||||||||
| NI Conservatives | Neil Wilson | 1.3 | 477 | 477.36 | 482.36 | 483.50 | ||||||||||
| SDLP | Amy Doherty | 0.4 | 141 | 141.76 | ||||||||||||
| NI Labour | Erskine Holmes | 0.2 | 78 | 78 | ||||||||||||
| Electorate: 65,740 Valid: 37,175 Spoilt: 448 (1.19%) Quota: 5,311 Turnout: 57.23 | ||||||||||||||||
2011
| 2011 Assembly election: Belfast East – 6 Seats[3] | |||||||||||||||
|---|---|---|---|---|---|---|---|---|---|---|---|---|---|---|---|
| Party | Candidate | % 1st Pref | Count 1 | Count 2 | Count 3 | Count 4 | Count 5 | Count 6 | Count 7 | Count 8 | Count 9 | Count 10 | Count 11 | ||
| DUP | Peter Robinson | 28.3 | 9,141 | ||||||||||||
| DUP | Robin Newton | 7.5 | 2,436 | 4,801 | |||||||||||
| Alliance | Judith Cochrane | 13.4 | 4,329 | 4,432 | 4,433 | 4,449 | 4,498 | 4,572 | 4,755 | ||||||
| Alliance | Chris Lyttle | 12.9 | 4,183 | 4,307 | 4,309 | 4,320 | 4,331 | 4,420 | 4,530 | 4,572 | 4,696 | ||||
| DUP | Sammy Douglas | 8.3 | 2,668 | 3,683 | 3,809 | 3,820 | 3,831 | 3,892 | 3,941 | 4,053 | 4,078 | 4,455 | 4,783 | ||
| UUP | Michael Copeland | 6.8 | 2,194 | 2,355 | 2,357 | 2,357 | 2,383 | 2,437 | 2,476 | 2,618 | 2,625 | 3,225 | 3,723 | ||
| Independent | Dawn Purvis | 5.3 | 1,702 | 1,909 | 1,911 | 1,926 | 1,955 | 2,010 | 2,094 | 2,179 | 2,229 | 2,320 | 2,789 | ||
| PUP | Brian Ervine | 4.6 | 1,493 | 1,667 | 1,670 | 1,671 | 1,681 | 1,761 | 1,787 | 1,873 | 1,884 | 1,963 | |||
| UUP | Philip Robinson | 2.9 | 943 | 1,130 | 1,131 | 1,139 | 1,142 | 1,161 | 1,189 | 1,294 | 1,296 | ||||
| Sinn Féin | Niall Ó Donnghaile | 3.2 | 1,030 | 1,037 | 1,037 | 1,061 | 1,070 | 1,127 | 1,148 | 1,149 | |||||
| TUV | Harry Toan | 2.2 | 712 | 744 | 744 | 745 | 753 | 801 | 824 | ||||||
| Green (NI) | Martin Gregg | 1.8 | 572 | 614 | 614 | 624 | 649 | 691 | |||||||
| BNP | Ann Cooper | 1.0 | 337 | 355 | 355 | 358 | 365 | ||||||||
| SDLP | Magdalena Wolska | 0.8 | 250 | 253 | 253 | 270 | 275 | ||||||||
| Socialist Party | Thomas Black | 0.6 | 201 | 205 | 205 | 217 | |||||||||
| Workers' Party | Kevin McNally | 0.3 | 102 | 107 | 107 | ||||||||||
| Independent | Stephen Stewart | 0.1 | 46 | 54 | 54 | ||||||||||
| Electorate: 61,263 Valid: 32,347 Spoilt: 481 (1.47) Quota: 4,622 Turnout: 32,828 (53.59) | |||||||||||||||
2007
| 2007 Assembly election: Belfast East – 6 Seats[4] | |||||||||||||
|---|---|---|---|---|---|---|---|---|---|---|---|---|---|
| Party | Candidate | % 1st Pref | Count 1 | Count 2 | Count 3 | Count 4 | Count 5 | Count 6 | Count 7 | Count 8 | Count 9 | Count 10 | |
| DUP | Peter Robinson | 19.0 | 5,635 | ||||||||||
| Alliance | Naomi Long | 18.8 | 5,583 | ||||||||||
| UUP | Reg Empey | 14.0 | 4,139 | 4,231.40 | 4,620.40 | ||||||||
| PUP | Dawn Purvis | 10.3 | 3,045 | 3,113.88 | 3,307.63 | 3,336.13 | 3,403.11 | 3,455.86 | 3,611.83 | 3,654.32 | 3,842.92 | 4,208.17 | |
| DUP | Wallace Browne | 10.7 | 3,185 | 3,416.60 | 3,453.10 | 3,462.35 | 3,488.06 | 3,541.78 | 3,607.97 | 3,608.71 | 3,709.10 | 3,734.32 | |
| DUP | Robin Newton | 7.9 | 2,335 | 3,201.88 | 3,241.38 | 3,250.38 | 3,270.35 | 3,316.30 | 3,355.75 | 3,359.75 | 3,497.13 | 3,516.62 | |
| UUP | Michael Copeland | 5.3 | 1,557 | 1,567.08 | 1,654.58 | 1,817.33 | 1,834.83 | 1,951.08 | 2,068.32 | 2,073.82 | 2,743.06 | 2,999.31 | |
| SDLP | Mary Muldoon | 2.8 | 816 | 816.96 | 1,020.71 | 1,036.96 | 1,097.70 | 1,115.20 | 1,306.95 | 1,902.95 | 1,933.94 | ||
| UUP | Jim Rodgers | 2.8 | 820 | 884.08 | 971.08 | 1,078.08 | 1,104.55 | 1,191.03 | 1,280.77 | 1,284.27 | |||
| Sinn Féin | Niall Ó Donnghaile | 3.6 | 1,055 | 1,056.44 | 1,071.94 | 1,072.44 | 1,087.69 | 1,087.69 | 1,123.94 | ||||
| Green (NI) | Steven Agnew | 2.2 | 653 | 658.04 | 852.04 | 870.29 | 983.78 | 1,064.28 | |||||
| NI Conservatives | Glyn Chambers | 1.4 | 427 | 429.88 | 483.13 | 494.38 | 516.13 | ||||||
| Socialist Party | Thomas Black | 0.8 | 225 | 227.88 | 246.63 | 248.13 | |||||||
| Workers' Party | Joseph Bell | 0.4 | 107 | 107.96 | 118.46 | 118.96 | |||||||
| Make Politicians History | Rainbow George | 0.2 | 47 | 47.24 | 51.74 | 52.99 | |||||||
| Electorate: 49,757 Valid: 29,629 Spoilt: 244 (0.82) Quota: 4,233 Turnout: 29,873 (60.04) | |||||||||||||
2003
| 2003 Assembly election: Belfast East – 6 Seats | |||||||||
|---|---|---|---|---|---|---|---|---|---|
| Party | Candidate | % 1st Pref | Count 1 | Count 2 | Count 3 | Count 4 | Count 5 | Count 6 | |
| DUP | Peter Robinson | 29.9% | 9,254 | ||||||
| UUP | Reg Empey | 20.9% | 6,459 | ||||||
| DUP | Robin Newton | 4.8% | 1,475 | 4,418 | 4,444 | ||||
| PUP | David Ervine | 9.7% | 2,990 | 3,212 | 3,377 | 3,509 | 3,661 | 4,263 | |
| Alliance | Naomi Long | 9.0% | 2,774 | 2,794 | 2,877 | 3,011 | 4,012 | 4,057 | |
| UUP | Michael Copeland | 7.4% | 2,291 | 2,355 | 3,133 | 3,221 | 3,298 | 3,650 | |
| UUP | Jim Rodgers | 4.9% | 1,502 | 1,791 | 2,682 | 2,783 | 2,839 | 3,296 | |
| DUP | Harry Toan | 4.5% | 1,403 | 2,633 | 2,643 | 2,717 | 2,728 | ||
| Sinn Féin | Joseph O'Donnell | 3.8% | 1,180 | 1,184 | 1,186 | 1,206 | |||
| SDLP | Leo Van Es | 3.1% | 967 | 970 | 986 | 1,036 | |||
| NI Conservatives | Terence Dick | 0.8% | 232 | 234 | 251 | ||||
| Socialist | Thomas Black | 0.6% | 176 | 181 | 184 | ||||
| Workers' Party | Joseph Bell | 0.4% | 125 | 128 | 129 | ||||
| Independent | John McBlain | 0.2% | 72 | 79 | 81 | ||||
| Rainbow Dream Ticket | Rainbow George Weiss | 0.2% | 65 | 67 | 67 | ||||
| Electorate: 51,937 Valid: 30,965 Spoilt: 559 (1.77%) Quota: 4,424 Turnout: 60.70% | |||||||||
1998
| 1998 Assembly election: Belfast East – 6 Seats | ||||||||||||||||||
|---|---|---|---|---|---|---|---|---|---|---|---|---|---|---|---|---|---|---|
| Party | Candidate | % 1st Pref | Count 1 | Count 2 | Count 3 | Count 4 | Count 5 | Count 6 | Count 7 | Count 8 | Count 9 | Count 10 | Count 11 | Count 12 | Count 13 | Count 14 | Count 15 | |
| DUP | Peter Robinson | 28.3% | 11,219 | |||||||||||||||
| Alliance | John Alderdice | 15.5% | 6,144 | |||||||||||||||
| PUP | David Ervine | 12.9% | 5,114 | 5,299 | 5,338 | 5,357 | 5,378 | 5,599 | 5,693 | |||||||||
| UUP | Reg Empey | 13.0% | 5,158 | 5,288 | 5,325 | 5,328 | 5,369 | 5,372 | 5,422 | 5,497 | 5,591 | 5,593 | 5,626 | 6,109 | ||||
| DUP | Sammy Wilson | 1.6% | 633 | 4,486 | 4,488 | 4,488 | 4,507 | 4,520 | 4,530 | 4,617 | 4,638 | 4,641 | 5,532 | 5,711 | ||||
| UUP | Ian Adamson | 8.7% | 3,447 | 3,510 | 3,530 | 3,534 | 3,582 | 3,586 | 3,632 | 3,682 | 3,747 | 3,749 | 3,774 | 4,181 | 4,568 | 4,636 | 5,415 | |
| Alliance | Richard Good | 2.5% | 1,000 | 1,010 | 1,290 | 1,309 | 1,325 | 1,331 | 1,417 | 1,440 | 1,757 | 1,814 | 1,824 | 1,865 | 1,888 | 2,864 | 2,975 | |
| UK Unionist | Denny Vitty | 3.4% | 1,362 | 1,674 | 1,675 | 1,675 | 1,704 | 1,709 | 1,723 | 1,756 | 1,773 | 1,773 | 1,880 | 2,000 | 2,023 | 2,026 | ||
| SDLP | Peter Jones | 2.6% | 1,025 | 1,027 | 1,035 | 1,055 | 1,055 | 1,057 | 1,067 | 1,069 | 1,225 | 1,589 | 1,590 | 1,593 | 1,594 | |||
| UUP | Jim Rodgers | 2.6% | 1,015 | 1,190 | 1,195 | 1,196 | 1,212 | 1,221 | 1,238 | 1,285 | 1,313 | 1,316 | 1,349 | |||||
| DUP | John Norris | 0.1% | 373 | 1,097 | 1,097 | 1,098 | 1,103 | 1,107 | 1,111 | 1,161 | 1,171 | 1,172 | ||||||
| Sinn Féin | Joseph O'Donnell | 2.3% | 917 | 917 | 918 | 929 | 929 | 929 | 937 | 938 | 952 | |||||||
| NI Women's Coalition | Pearl Sagar | 1.8% | 711 | 723 | 735 | 748 | 752 | 763 | 800 | 822 | ||||||||
| Ulster Democratic | Robert Girvan | 1.3% | 516 | 566 | 567 | 568 | 570 | 579 | 590 | |||||||||
| Labour Party NI | David Bleakley | 0.9% | 369 | 377 | 390 | 400 | 408 | 409 | ||||||||||
| PUP | Dawn Purvis | 0.7% | 271 | 287 | 287 | 289 | 290 | |||||||||||
| NI Conservatives | Lesley Donaldson | 0.5% | 203 | 222 | 224 | 227 | ||||||||||||
| Workers' Party | Joseph Bell | 0.2% | 79 | 80 | 82 | |||||||||||||
| Natural Law | David Collins | 0.1% | 22 | 22 | 22 | |||||||||||||
| Independent | John Lawrence | 0.04% | 15 | 15 | 15 | |||||||||||||
| Electorate: 60,562 Valid: 39,593 Spoilt: 763 (1.89%) Quota: 5,657 Turnout: 66.63% | ||||||||||||||||||
1996 Forum
Successful candidates are shown in bold.[5]
| Party | Candidate(s) | Votes | Percentage | |
|---|---|---|---|---|
| DUP | Peter Robinson Sammy Wilson Robert Newton Irene Lewis Wallace Browne |
11,270 | 29.4 | |
| UUP | Reg Empey Jim Rodgers Ian Adamson Alan Crowe |
8,608 | 22.5 | |
| Alliance | John Alderdice Peter Osborne Danny Dow Mervyn Jones Maureen McConnell |
7,130 | 18.6 | |
| PUP | David Ervine Patricia Laverty Rosemary Reynolds John McQuillen Alec Gordon |
3,802 | 9.9 | |
| UK Unionist | Alan Field Maureen Ann McCartney |
2,496 | 6.5 | |
| SDLP | Peter Prendiville Brian Heading |
1,299 | 3.4 | |
| Ulster Democratic | Robert Girvan Jacqueline Upton Ronald Stitt Samuel Walkingshaw Joseph McMaster |
1,156 | 3.1 | |
| Sinn Féin | Michael McVeigh Brid Duffy Anna Doherty |
862 | 2.2 | |
| NI Women's Coalition | Felicity Huston Pearl Sagar Annie Quinn Kate Campbell Karen Snoddy |
405 | 1.1 | |
| NI Conservatives | Ian Donaldson Dorothy Dunlop |
291 | 0.8 | |
| Labour coalition | Gail Haslett Thomas Black Barbara Hawites David Bell Maeve O'Leary |
199 | 0.5 | |
| Democratic Partnership | David Bleakley Edwin Sloan |
197 | 0.5 | |
| Green (NI) | Similda Osoba April McCarthy |
161 | 0.4 | |
| Workers' Party | Joe Bell Marie Mooney |
149 | 0.4 | |
| Ulster Independence | Gavin Boyd Mark Black David McClinton |
114 | 0.3 | |
| Independent DUP | Jean Toad David Kerr |
93 | 0.2 | |
| Democratic Left | Michael Craig June Campion |
45 | 0.1 | |
| Communist Party | Andrew Gibb Sarah Stewart |
38 | 0.1 | |
| Natural Law | Robert Johnstone Richard Johnson Ian Long |
13 | 0.0 | |
| Independent Chambers | Ian Arbuthnot Alan Hay |
11 | 0.0 | |
1982
| 1982 Assembly election: Belfast East – 6 Seats | |||||||||||||
|---|---|---|---|---|---|---|---|---|---|---|---|---|---|
| Party | Candidate | % 1st Pref | Count 1 | Count 2 | Count 3 | Count 4 | Count 5 | Count 6 | Count 7 | Count 8 | Count 9 | Count 10 | |
| DUP | Peter Robinson | 38.9% | 15,319 | ||||||||||
| UUP | Jeremy Burchill | 18.6% | 7,345 | ||||||||||
| Alliance | Oliver Napier | 15.3% | 6,037 | ||||||||||
| DUP | Denny Vitty | 0.6% | 235 | 7,583 | |||||||||
| UUP | Dorothy Dunlop | 4.3% | 1,696 | 2,066 | 2,087 | 3,271 | 3,309 | 3,323 | 3,347 | 3,512 | 4,565 | 5,981 | |
| Alliance | Addie Morrow | 7.5% | 2,966 | 3,057 | 3,062 | 3,088 | 3,093 | 3,402 | 3,740 | 3,794 | 4,491 | 4,881 | |
| DUP | Sammy Wilson | 1.0% | 397 | 1,239 | 3,024 | 3,044 | 3,061 | 3,065 | 3,081 | 3,259 | 3,400 | 4,170 | |
| Vanguard | William Craig | 5.8% | 2,274 | 2,806 | 2,826 | 2,964 | 2,989 | 3,000 | 3,025 | 3,190 | 3,361 | ||
| UUP | William Johnstone | 2.5% | 973 | 1,126 | 1,136 | 1,377 | 1,394 | 1,398 | 1,408 | 1,520 | |||
| SDLP | Peter Prendiville | 2.6% | 868 | 873 | 875 | 875 | 875 | 881 | 1,090 | ||||
| UUUP | Reg Empey | 1.3% | 503 | 649 | 655 | 691 | 769 | 772 | 777 | ||||
| Workers' Party | Francis Cullen | 1.7% | 681 | 696 | 697 | 704 | 707 | 712 | |||||
| UUUP | Ben Horan | 0.3% | 123 | 185 | 187 | 199 | |||||||
| Electorate: 74,273 Valid: 39,417 Spoilt: 1,275 (3.13%) Quota: 5,657 Turnout: 54.79% | |||||||||||||
- Craig stood as Vanguard, although the party itself had been disbanded four years before.
1975 Constitutional Convention
| 1975 Constitutional Convention: Belfast East - 6 seats | ||||||||||||||
|---|---|---|---|---|---|---|---|---|---|---|---|---|---|---|
| Party | Candidate | % 1st Pref | Count 1 | Count 2 | Count 3 | Count 4 | Count 5 | Count 6 | Count 7 | Count 8 | Count 9 | Count 10 | Count 11 | |
| Vanguard | William Craig | 23.8 | 11,958 | |||||||||||
| Alliance | Oliver Napier | 12.6 | 6,341 | 6,393 | 6,449 | 6,469.40 | 6,537.40 | 7,450.40 | ||||||
| Vanguard | Reg Empey | 9.3 | 4,657 | 6,825.40 | 6,844 | 6,978.20 | 7,063.80 | 7,121.20 | 7,121.20 | 8,297.20 | ||||
| Unionist Party NI | Joshua Cardwell | 6.1 | 3,039 | 3,164.60 | 3,180 | 3,220.80 | 3,366.80 | 3,586.20 | 3,605.60 | 3,718 | 3,756.22 | 6,209.52 | 7,475.52 | |
| DUP | Eileen Paisley | 7.1 | 3,606 | 4,893.60 | 4,916.60 | 5,073 | 5,179.60 | 5,214.40 | 5,214.40 | 6,157.80 | 6,653.68 | 6,729.86 | 7,354.86 | |
| NI Labour | David Bleakley | 8.0 | 3,998 | 4,059.60 | 4,417 | 4,473.20 | 4,548.40 | 5,556.20 | 5,714.20 | 5,864 | 5,885.56 | 6,257.76 | 6,924.54 | |
| DUP | Peter Robinson | 7.8 | 3,933 | 4,165 | 4,173.80 | 4,209.80 | 4,253 | 4,283.20 | 4,283.60 | 4,672.60 | 5,156.72 | 5,201.88 | 5,792.52 | |
| UUP | Roy Bradford | 5.1 | 2,583 | 2,828.60 | 2,839 | 2,873.60 | 2,991.40 | 3,092 | 3,096.80 | 3,362.40 | 3,431.98 | 3,756.46 | ||
| Unionist Party NI | Norman Agnew | 5.7 | 2,863 | 2,913.40 | 2,918.20 | 2,929.60 | 3,011.80 | 3,262.40 | 3,287.60 | 3,370.80 | 3,387.46 | |||
| UUP | David McNarry | 5.2 | 2,609 | 2,941.80 | 2,944.60 | 2,978.60 | 3,065.80 | 3,093.60 | 3,094 | |||||
| Alliance | Kate Condy | 3.0 | 1,485 | 1,500.20 | 1,508 | 1,511 | 1,539 | |||||||
| SDLP | Alban Maginness | 2.5 | 1,274 | 1,278.40 | 1,286.40 | 1,287.20 | 1,293.20 | |||||||
| Independent Unionist | Walter McFarland | 1.5 | 775 | 885.40 | 860.80 | 887.20 | ||||||||
| Independent Unionist | William Elliot | 1.0 | 509 | 591.80 | 606 | |||||||||
| Labour Party NI | Sandy Scott | 1.0 | 530 | 543.60 | ||||||||||
| Electorate: 78,340 Valid: 50,160 Spoilt: 917 (1.6%) Quota: 7,166 Turnout: 51,133 (65.3%) | ||||||||||||||
1973
| 1973 Assembly election: Belfast East - 6 seats | |||||||||||||||||||||
|---|---|---|---|---|---|---|---|---|---|---|---|---|---|---|---|---|---|---|---|---|---|
| Party | Candidate | % 1st Pref | Count 1 | Count 2 | Count 3 | Count 4 | Count 5 | Count 6 | Count 7 | Count 8 | Count 9 | Count 10 | Count 11 | Count 12 | Count 13 | Count 14 | Count 15 | Count 16 | Count 17 | Count 18 | |
| UUP | Roy Bradford | 23.2 | 13,187 | ||||||||||||||||||
| UUP | Joshua Cardwell | 8.8 | 5,001 | 6,635 | 6,643.38 | 6,649.38 | 6,672.90 | 6,754.40 | 6,871.78 | 7,002.74 | 7,035.68 | 7,063.44 | 7,072.20 | 7,571.96 | 8,177.96 | ||||||
| DUP | Eileen Paisley | 9.7 | 5,518 | 5,613 | 5,618.76 | 5,628.52 | 5,717.66 | 5,737.08 | 5,780.17 | 6,127.42 | 6,142.56 | 6,393.08 | 6,396.08 | 7,069.44 | 7,170.70 | 7,172.47 | 8,907.47 | ||||
| UUP | Norman Agnew | 6.4 | 3,615 | 4,562.34 | 4,565.24 | 4,568.10 | 4,571.48 | 4,635.72 | 4,763.72 | 4,832.42 | 4,860.84 | 4,878.22 | 4,922.60 | 5,096.66 | 5,733.94 | 5,758.25 | 5,842.24 | 7,197.91 | 7,229.23 | 8,027.29 | |
| Alliance | Oliver Napier | 8.7 | 4,941 | 5,086.92 | 5,089.68 | 5,103.20 | 5,103.20 | 5,112.24 | 5,121.76 | 5,129.90 | 6,213.42 | 6,219.80 | 7,049.80 | 7,074.56 | 7,169.92 | 7,171.57 | 7,197.47 | 7,336.93 | 7,341.79 | 7,418.97 | |
| NI Labour | David Bleakley | 7.8 | 4,425 | 4,710.76 | 4,743.76 | 4,866.52 | 4,874.52 | 4,899.70 | 4,932.88 | 4,953.78 | 5,043.34 | 5,053.10 | 5,878.10 | 5,993.14 | 6,108.02 | 6,111.10 | 6,155.14 | 6,368.65 | 6,389.17 | 6,690.47 | |
| UUP | Walter McFarland | 4.6 | 2,597 | 3,000.94 | 3,002.32 | 3,005.46 | 3,015.84 | 3,120.52 | 3,432.38 | 3,499.12 | 3,526.44 | 3,541.20 | 3,548.58 | 3,662.52 | 4,085.54 | 4,102.48 | 4,271.55 | 5,435.29 | 5,469.31 | 6,436.15 | |
| Vanguard | Jim Rodgers | 3.4 | 1,947 | 1,972.46 | 1,974.46 | 1,975.46 | 2,068.60 | 2,070.36 | 2,076.12 | 2,152.02 | 2,154.02 | 3,133.20 | 3,134.20 | 3,509.86 | 3,550.38 | 3,550.82 | 4,492.23 | 4,683.96 | 5,386.40 | ||
| UUP | David McNarry | 3.1 | 1,784 | 2,145.76 | 2,145.76 | 2,148.14 | 2,155.14 | 2,306.02 | 2,504.64 | 2,544.68 | 2,558.96 | 2,580.10 | 2,583.48 | 2,642.62 | 3,182.40 | 3,199.23 | 3,237.89 | ||||
| Vanguard | Tommy Herron | 4.4 | 2,480 | 2,519.90 | 2,524.90 | 2,526.90 | 2,561.28 | 2,564.80 | 2,577.94 | 2,665.88 | 2,672.26 | 2,719.26 | 2,722.26 | 3,122.34 | 3,146.76 | 3,147.20 | |||||
| UUP | Walter Scott | 3.2 | 1,806 | 2,326.98 | 2,328.98 | 2,329.98 | 2,341.36 | 2,395.98 | 2,512.24 | 2,539.66 | 2,556.22 | 2,568.98 | 2,568.98 | 2,614.12 | |||||||
| Independent Unionist | William Annon | 3.9 | 2,192 | 2,248.62 | 2,252.62 | 2,254.62 | 2,293.76 | 2,298.14 | 2,306.52 | 2,455.56 | 2,465.62 | 2,517.46 | 2,528.46 | ||||||||
| SDLP | Owen Adams | 3.3 | 1,849 | 1,850.90 | 1,856.90 | 1,857.90 | 1,858.90 | 1,858.90 | 1,858.90 | 1,859.90 | 1,865.90 | 1,865.90 | |||||||||
| Vanguard | Thomas Smith | 2.3 | 1,332 | 1,343.40 | 1,343.40 | 1,343.40 | 1,384.78 | 1,385.78 | 1,390.78 | 1,444.16 | 1,445.16 | ||||||||||
| Alliance | Kate Condy | 2.2 | 1,256 | 1,297.04 | 1,302.80 | 1,310.94 | 1,318.32 | 1,329.74 | 1,341.26 | 1,346.02 | |||||||||||
| Independent Unionist | Michael Brooks | 1.7 | 983 | 1,063.56 | 1,064.56 | 1,065.56 | 1,082.56 | 1,086.94 | 1,096.70 | ||||||||||||
| UUP | John McKeown | 1.5 | 831 | 973.88 | 973.88 | 974.26 | 975.26 | 1,014.60 | |||||||||||||
| UUP | Elsie Logan | 0.7 | 394 | 573.36 | 575.36 | 575.36 | 579.36 | ||||||||||||||
| Ulster Constitution | Lindsay Mason | 0.4 | 202 | 205.04 | 205.42 | 206.42 | |||||||||||||||
| Independent Unionist | Samuel Smyth | 0.3 | 189 | 192.80 | 193.80 | 194.80 | |||||||||||||||
| NI Labour | John Coulthard | 0.2 | 129 | 136.22 | 180.60 | ||||||||||||||||
| NI Labour | William Gunning | 0.2 | 107 | 110.42 | |||||||||||||||||
| Independent | Sarah Hughes | 0.1 | 19 | 19.38 | |||||||||||||||||
| Electorate: 80,421 Valid: 56,784 Spoilt: 917 (1.6%) Quota: 8,113 Turnout: 57,701 (71.7%) | |||||||||||||||||||||
References
- ↑ "Statement of Persons Nominated". EONI. Retrieved 8 February 2017.
- ↑ https://www.bbc.co.uk/news/politics/northern-ireland-constituencies/N06000001
- ↑ "Northern Ireland Assembly elections: East Belfast results", Belfast Telegraph, 7 May 2011
- ↑ "Archived copy" (PDF). Archived from the original (PDF) on 21 July 2011. Retrieved 2011-05-07. , Electoral Office for Northern Ireland - NI Assembly Election 7 March 2007
- ↑ 1996 Candidates – East Belfast, Northern Ireland Elections
| Assembly |   | |
|---|---|---|
| Committees | ||
| Constituencies | ||
| Parties | ||
| Elections | ||
| Members |
| |
| Procedure | ||
| See also | ||