Austrian legislative election, 1999

|
|
|
All 183 seats in the National Council
92 seats needed for a majority |
|---|
| Turnout |
4,695,225 (80.42%)[1] |
|---|
| |
First party |
Second party |
| |
.JPG) |
.jpg) |
| Leader |
Viktor Klima |
Jörg Haider |
| Party |
SPÖ |
FPÖ |
| Leader since |
1997 |
1986 |
| Leader's seat |
3 Lower Austria |
2A Klagenfurt |
| Last election |
71 seats, 38.06% |
41 seats, 21.89% |
| Seats won |
65 |
52 |
| Seat change |
 6 6 |
 11 11 |
| Popular vote |
1,532,448 |
1,244,087 |
| Percentage |
33.15% |
26.91% |
| Swing |
4.91% |
5.02% |
|
| |
Third party |
Fourth party |
| |
 |
 |
| Leader |
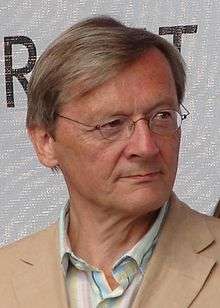
Wolfgang Schüssel |
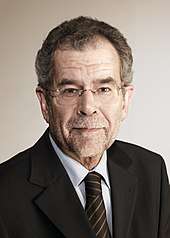
Alexander Van der Bellen |
| Party |
ÖVP |
Greens |
| Leader since |
1995 |
1997 |
| Leader's seat |
9E Vienna South-West |
9F Vienna North-West |
| Last election |
52 seats, 28.29% |
9 seats, 4.81% |
| Seats won |
52 |
14 |
| Seat change |
0 |
5 |
| Popular vote |
1,243,672 |
342,260 |
| Percentage |
26.91% |
7.40% |
| Swing |
1.38% |
2.59% |
|
|
|
Parliamentary elections were held in Austria on 3 October 1999.[2]
Although the Social Democratic Party remained the largest party in the National Council, a right-wing coalition government was formed by the Freedom Party of Austria (FPÖ) and the Austrian People's Party (ÖVP) after several months of negotiations. Although the FPÖ had finished a fraction of a point ahead of the ÖVP in the popular vote, ÖVP leader Wolfgang Schüssel became Chancellor rather than controversial FPÖ leader Jörg Haider. Haider, who had also been elected Landeshauptmann of Carinthia, was not appointed to the cabinet and resigned as party leader.[3]
However, foreign governments remained critical of the FPÖ's inclusion in the government and the fourteen other members of the European Union imposed sanctions on the country, whilst domestically the government faced protests organised by the SPÖ and Greens.[3] However, this pressure on the government helped stabilise it and when it became clear that the FPÖ was not a threat to the country's democracy, sanctions were lifted.[3]
Voter turnout was 80.4%.[4]
Results
| Party |
Votes |
% |
Seats |
+/– |
|---|
| Social Democratic Party | 1,532,448 | 33.2 | 65 | –6 |
| Freedom Party of Austria | 1,244,087 | 26.9 | 52 | +11 |
| Austrian People's Party | 1,243,672 | 26.9 | 52 | 0 |
| Green Alternative | 342,260 | 7.4 | 14 | +5 |
| Liberal Forum | 168,612 | 3.6 | 0 | –10 |
| The Independents | 46,943 | 1.0 | 0 | New |
| Communist Party of Austria | 22,016 | 0.5 | 0 | 0 |
| No - Civic Action Group against the sale of Austria | 19,286 | 0.4 | 0 | 0 |
| Christian Electoral Community | 3,030 | 0.1 | 0 | New |
| Invalid/blank votes | 72,871 | – | – | – |
| Total | 4,695,225 | 100 | 183 | 0 |
| Source: Nohlen & Stöver |
| Popular vote |
|---|
|
|
|
|
|
| SPÖ |
|
33.15% |
| FPÖ |
|
26.91% |
| ÖVP |
|
26.91% |
| GRÜNE |
|
7.40% |
| LIF |
|
3.65% |
| DU |
|
1.02% |
| Other |
|
0.96% |
|
| Parliamentary seats |
|---|
|
|
|
|
|
| SPÖ |
|
35.52% |
| FPÖ |
|
28.42% |
| ÖVP |
|
28.42% |
| GRÜNE |
|
7.65% |
|