Climate of Antarctica
The climate of Antarctica is the coldest on Earth.
The continent is also extremely dry (it is technically a desert), averaging 166 mm (6.5 in) of precipitation per year. Snow rarely melts on most parts of the continent, and, after being compressed, becomes the glacier ice that makes up the ice sheet. Weather fronts rarely penetrate far into the continent, because of the katabatic winds. Most of Antarctica has an ice-cap climate (Köppen classification EF) with very cold, generally extremely dry weather.
Temperature
The highest temperature ever recorded on Antarctica was 20.75 °C (69.3 °F)[1] at Comandante Ferraz Antarctic Station on 9 February 2020, beating the previous record of 18.3 °C (64.9 °F) at Esperanza Base, on the northern tip of the Antarctic Peninsula, on 6 February 2020,[2][3]
A higher temperature of 19.8 °C (67.6 °F) recorded at Signy Research Station on 30 January 1982 was the record for the Antarctic region encompassing all land and ice south of 60° S.[4]
The lowest air temperature record, the lowest reliably measured temperature on Antarctica was set on 21 July 1983, when −89.2 °C (−128.6 °F) was observed at Vostok Station.[4][5] For comparison, this is 10.7 °C (19.3 °F) colder than subliming dry ice (at sea level pressure). The altitude of the location is 3,488 meters (11,444 feet).
Satellite measurements have identified even lower ground temperatures, with −93.2 °C (−135.8 °F) having been observed at the cloud-free East Antarctic Plateau on 10 August 2010.[6]
The lowest recorded temperature of any location on Earth's surface at 81.8°S 63.5°E was revised with new data in 2018 in nearly 100 locations, ranging from −93.2 °C (−135.8 °F)[7] to −98 °C (−144.4 °F).[8] This unnamed part of the Antarctic plateau, between Dome A and Dome F, was measured on 10 August 2010, and the temperature was deduced from radiance measured by the Landsat 8 and other satellites, and discovered during a National Snow and Ice Data Center review of stored data in December 2013[9] but revise by researcher on 25 June 2018.[10][11] This temperature is not directly comparable to the –89.2 °C reading quoted above, since it is a skin temperature deduced from satellite-measured upwelling radiance, rather than a thermometer-measured temperature of the air 1.5 m (4.9 ft) above the ground surface.
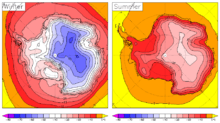
The mean annual temperature of the interior is −57 °C (−70.6 °F). The coast is warmer; on the coast Antarctic average temperatures are around −10 °C (14.0 °F) (in the warmest parts of Antarctica) and in the elevated inland they average about −55 °C (−67.0 °F) in Vostok.[12][13] Monthly means at McMurdo Station range from −26 °C (−14.8 °F) in August to −3 °C (26.6 °F) in January.[14] At the South Pole, the highest temperature ever recorded was −12.3 °C (9.9 °F) on 25 December 2011.[15] Along the Antarctic Peninsula, temperatures as high as 15 °C (59 °F) have been recorded, though the summer temperature is below 0 °C (32 °F) most of the time. Severe low temperatures vary with latitude, elevation, and distance from the ocean. East Antarctica is colder than West Antarctica because of its higher elevation. The Antarctic Peninsula has the most moderate climate. Higher temperatures occur in January along the coast and average slightly below freezing.
Precipitation
The total precipitation on Antarctica, averaged over the entire continent, is about 166 millimetres (6.5 inches) per year (Vaughan et al., J Climate, 1999). The actual rates vary widely, from high values over the Peninsula (15 to 25 inches a year) to very low values (as little as 50 millimetres (2.0 inches) in the high interior (Bromwich, Reviews of Geophysics, 1988). Areas that receive less than 250 millimetres (9.8 inches) of precipitation per year are classified as deserts. Almost all Antarctic precipitation falls as snow.[16] Rainfall is rare and mainly occurs during the summer in coastal areas and surrounding islands.[16] Note that the quoted precipitation is a measure of its equivalence to water, rather than being the actual depth of snow. The air in Antarctica is also very dry. The low temperatures result in a very low absolute humidity, which means that dry skin and cracked lips are a continual problem for scientists and expeditioners working in the continent.
Weather condition classification
The weather in Antarctica can be highly variable, and the weather conditions can often change dramatically in short periods of time. There are various classifications for describing weather conditions in Antarctica; restrictions given to workers during the different conditions vary by station and nation.[17][18][19]
Ice cover
Nearly all of Antarctica is covered by a sheet of ice that is, on average, a mile thick or more (1.6 km). Antarctica contains 90% of the world's ice and more than 70% of its fresh water. If all the land-ice covering Antarctica were to melt — around 30 million cubic kilometres (7.2 million cubic miles) of ice — the seas would rise by over 60 metres (200 feet).[20] This is, however, very unlikely within the next few centuries. The Antarctic is so cold that even with increases of a few degrees, temperatures would generally remain below the melting point of ice. Higher temperatures are expected to lead to more precipitation, which takes the form of snow. This would increase the amount of ice in Antarctica, offsetting approximately one third of the expected sea level rise from thermal expansion of the oceans.[21] During a recent decade, East Antarctica thickened at an average rate of about 1.8 centimetres (0.71 in) per year while West Antarctica showed an overall thinning of 0.9 centimetres (0.35 in) per year.[22] For the contribution of Antarctica to present and future sea level change, see sea level rise. Because ice flows, albeit slowly, the ice within the ice sheet is younger than the age of the sheet itself.
| Surface | Area (km²) |
Percent | Mean ice thickness (m) |
Volume (km³) |
Percent |
|---|---|---|---|---|---|
| Inland ice sheet | 11,965,700 | 85.97 | 2,450 | 29,324,700 | 97.00 |
| Ice shelves | 1,541,710 | 11.08 | 475 | 731,900 | 2.43 |
| Ice rises | 78,970 | .57 | 670 | 53,100 | .18 |
| Glacier ice (total) | 13,586,380 | 2,160 | 30,109,800¹ | ||
| Rock outcrop | 331,690 | 2.38 | |||
| Antarctica (total) | 13,918,070 | 100.00 | 2,160 | 30,109,800¹ | 100.00 |
| ¹The total ice volume is different from the sum of the component parts because individual figures have been rounded. | |||||
| Region | Area (km²) |
Mean ice thickness (m) |
Volume (km³) |
|---|---|---|---|
| East Antarctica | |||
| Inland ice | 9,855,570 | 2,630 | 25,920,100 |
| Ice shelves | 293,510 | 400 | 117,400 |
| Ice rises | 4,090 | 400 | 1,600 |
| West Antarctica (excluding Antarctic Peninsula) | |||
| Inland ice sheet | 1,809,760 | 1,780 | 3,221,400 |
| Ice shelves | 104,860 | 375 | 39,300 |
| Ice rises | 3,550 | 375 | 1,300 |
| Antarctic Peninsula | |||
| Inland ice sheet | 300,380 | 610 | 183,200 |
| Ice shelves | 144,750 | 300 | 43,400 |
| Ice rises | 1,570 | 300 | 500 |
| Ross Ice Shelf | |||
| Ice shelf | 525,840 | 427 | 224,500 |
| Ice rises | 10,320 | 500 | 5,100 |
| Filchner-Ronne Ice Shelf | |||
| Ice shelf | 472,760 | 650 | 307,300 |
| Ice rises | 59,440 | 750 | 44,600 |
Ice shelves
About 75% of the coastline of Antarctica is shelf ice. The majority of shelf ice consists of floating ice, and a lesser amount consists of glaciers that move slowly from the land mass into the sea. Ice shelves lose mass through breakup of glacial ice (calving), or basal melting due to warm ocean water under the ice.[23]
Melting or breakup of floating shelf ice does not directly affect global sea levels; however, ice shelves have a buttressing effect on the ice flow behind them. If ice shelves break up, the ice flow behind them may accelerate, resulting in increasing melt of the Antarctic ice sheet and an increasing contribution to sea level.
Known changes in coastline ice:
- Around the Antarctic Peninsula:
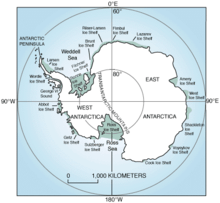
- 1936–1989: Wordie Ice Shelf significantly reduced in size.
- 1995: Ice in the Prince Gustav Channel disintegrated.
- Parts of the Larsen Ice Shelf broke up in recent decades.
- 1995: The Larsen A ice shelf disintegrated in January 1995.
- 2001: 3,250 square kilometres (1,250 square miles) of the Larsen B ice shelf disintegrated in February 2001. It had been gradually retreating before the breakup event.
- 2015: A study concluded that the remaining Larsen B ice-shelf will disintegrate by the end of the decade, based on observations of faster flow and rapid thinning of glaciers in the area.[24]
The George VI Ice Shelf, which may be on the brink of instability,[25] has probably existed for approximately 8,000 years, after melting 1,500 years earlier.[26] Warm ocean currents may have been the cause of the melting.[27] Not only the ice sheets are losing mass, but they are losing mass at an accelerating rate.[28]
Global warming

The continent-wide average surface temperature trend of Antarctica is positive – that is, the temperature is increasing – and significant at more than 0.05 °C (0.09 °F) per decade since 1957.[29][30][31][32] The West Antarctic ice sheet has warmed by more than 0.1 °C (0.18 °F) per decade in the last 50 years,[33] and is strongest in winter and spring. Although this is partly offset by fall cooling in East Antarctica, this effect is restricted to the 1980s and 1990s.[29][30][31]
Research published in 2009 found that overall the continent had become warmer since the 1950s, a finding consistent with the influence of man-made climate change. "We can't pin it down, but it certainly is consistent with the influence of greenhouse gases from fossil fuels", said NASA scientist Drew Shindell, one of the study's authors. Some of the effects could be due to natural variability, he added.[34]
The British Antarctic Survey, which has undertaken the majority of Britain's scientific research in the area, stated in 2009:[35]
- West Antarctic ice loss could contribute to 1.4 metres (4 feet 7 inches) sea level rise
- Antarctica predicted to warm by around 3 °C (5.4 °F) over this century
- 10% increase in sea ice around the Antarctic
- Rapid ice loss in parts of the Antarctic
- Warming of the Southern Ocean will cause changes in Antarctic ecosystem
- Hole in ozone layer, which has delayed the impact of greenhouse gas increases on Antarctica's climate
The area of strongest cooling appears at the South Pole, and the region of strongest warming lies along the Antarctic Peninsula. A possible explanation is that loss of UV-absorbing ozone may have cooled the stratosphere and strengthened the polar vortex, a pattern of spinning winds around the South Pole. The vortex acts like an atmospheric barrier, preventing warmer, coastal air from moving into the continent's interior. A stronger polar vortex might explain the cooling trend in the interior of Antarctica.[36]
In their latest study (20 September 2007) NASA researchers have confirmed that Antarctic snow is melting farther inland from the coast over time, melting at higher altitudes than ever and increasingly melting on Antarctica's largest ice shelf.[37]
There is also evidence for widespread glacier retreat around the Antarctic Peninsula.[38]
Researchers reported on 21 December 2012 in Nature Geoscience that from 1958 to 2010, the average temperature at the mile-high Byrd Station rose by 2.4 °C (4.3 °F), with warming fastest in its winter and spring. The spot, which is located in the heart of the West Antarctic Ice Sheet, is one of the fastest-warming places on Earth. In 2015, the temperature showed changes but in a stable manner and the only months that have drastic change in that year are August and September. It also did show that the temperature was very stable throughout the year.[39][40][41][42]
See also
- Antarctic oscillation
- Antarctica cooling controversy
- Climate of the Arctic
- Effects of global warming
- Polar amplification
- Retreat of glaciers since 1850
- Southern Ocean
References
Notes
- "Antarctic temperature rises above 20C for first time on record". The Guardian. 13 February 2020. Retrieved 17 February 2020.
- "New record for Antarctic continent reported". World Meteorological Organization. 7 February 2020. Retrieved 8 February 2020.
- "Antarctica logs hottest temperature on record of 18.3C". BBC News. 7 February 2020. Retrieved 8 February 2020.
- "WMO verifies highest temperatures for Antarctic Region". 1 March 2017. Retrieved 12 July 2018.
- "World: Lowest Temperature - ASU World Meteorological Organization". asu.edu. Archived from the original on 16 June 2010.
- Coldest spot on Earth identified by satellite Archived 14 April 2016 at the Wayback Machine, Jonathan Amos, BBC News, 9 December 2013.
- Natasha Vizcarra (9 December 2013). "Landsat 8 helps unveil the coldest place on Earth". National Snow and Ice Data Center. Archived from the original on 20 December 2013. Retrieved 27 December 2013.
- Natasha Vizcarra (25 May 2018). "New study explains Antarctica's coldest temperatures". The National Snow and Ice Data Center (NSIDC).
- Jonathan Amos (9 December 2013). "Coldest spot on Earth identified by satellite". BBC News Science & Environment. Archived from the original on 26 December 2013. Retrieved 27 December 2013.
- Ted Scambos (25 May 2018). "Scambros et al 2018" (PDF). The National Snow and Ice Data Center (NSIDC).
- NOT CORRECTED. "BBC Corrections and Clarifications page".
- "Antarctic weather". www.antarctica.gov.au. Archived from the original on 5 November 2016.
- "Archived copy". Archived from the original on 7 May 2008. Retrieved 7 May 2008.CS1 maint: archived copy as title (link)
- "Antarctica Climate data and graphs, South Pole, McMurdo and Vostok". coolantarctica.com. Archived from the original on 9 October 2010. Retrieved 14 May 2014.
- Matthew A. Lazzara (28 December 2011). "Preliminary Report: Record Temperatures at South Pole (and nearby AWS sites…)". Archived from the original on 30 December 2011. Retrieved 28 December 2011.
- "La Antártida" (in Spanish). Dirección Nacional del Antártico. Archived from the original on 13 November 2016. Retrieved 13 November 2016.
- "Weathering The Conditions" (PDF). The Antarctic Sun. 18 October 1997. p. 8. Archived (PDF) from the original on 9 June 2015. Retrieved 8 June 2015.
- Jim Scott. "Weather and Travel" (PDF). Welcome to McMurdo Station. McMurdo Station. p. 6. Archived from the original (PDF) on 10 September 2014. Retrieved 8 June 2015.
- "Field Manual" (PDF). Antarctica New Zealand. New Zealand Government. p. 37. Archived from the original (PDF) on 15 January 2015. Retrieved 8 June 2015.
- "Climate Change 2001: The Scientific Basis". Grida.no. Archived from the original on 16 December 2007. Retrieved 27 March 2011.
- "Climate Change 2001: The Scientific Basis". Grida.no. Archived from the original on 14 May 2011. Retrieved 27 March 2011.
- Davis CH, Li Y, McConnell JR, Frey MM, Hanna E (2005). "Snowfall-Driven Growth in East Antarctic Ice Sheet Mitigates Recent Sea-Level Rise". Science. 308 (5730): 1898–1901. Bibcode:2005Sci...308.1898D. doi:10.1126/science.1110662. PMID 15905362.
- E. Rignot; S. Jacobs; J. Mouginot; B. Scheuchl (2013). "Ice-Shelf Melting Around Antarctica". Science. 341 (6143): 266–270. Bibcode:2013Sci...341..266R. doi:10.1126/science.1235798. PMID 23765278. Archived from the original on 13 July 2015.
- NASA (14 May 2015). "NASA Study Shows Antarctica's Larsen B Ice Shelf Nearing Its Final Act". Archived from the original on 9 June 2015.
- Bentley, Mike; Hodgson, Dominic. "Millennial-scale variability of George VI Ice Shelf, Antarctic Peninsula". Natural Environment Research Council. Archived from the original on 12 September 2002. Retrieved 8 June 2015.
- Bentley, M.J. (1), Hjort, C. (2) Ingolfsson, O. (3) and Sugden, D.E. (4). "Holocene Instability of the George VI Ice Shelf, Antarctic Peninsula". Archived from the original on 20 October 2004. Retrieved 8 June 2015.CS1 maint: multiple names: authors list (link)
- "Press Release – New Year's Honours for British Antarctic Survey Personnel". British Antarctic Survey. 5 January 2006. Archived from the original on 15 December 2006.
- "NASA - Is Antarctica Melting?". www.nasa.gov. Archived from the original on 12 December 2016.
- Tenney Naumer. "Climate Change: The Next Generation". climatechangepsychology.blogspot.com. Archived from the original on 22 January 2009.
- Retrieved=2009-01-22 Archived 29 December 2008 at the Wayback Machine
- "Archived copy". Archived from the original on 24 January 2009. Retrieved 24 January 2009.CS1 maint: archived copy as title (link) Retrieved=2009-01-22
- "Global warming hitting all of Antarctica: scientists". The Sydney Morning Herald. Archived from the original on 17 March 2009.
- Steig, Eric J.; Schneider, David P.; Rutherford, Scott D.; Mann, Michael E.; Comiso, Josefino C.; Shindell, Drew T. (22 January 2009). "Warming of the Antarctic ice-sheet surface since the 1957 International Geophysical Year". Nature. 457 (7228): 459–462. doi:10.1038/nature07669. PMID 19158794. Retrieved 2 May 2019 – via Goddard Institute for Space Studies, NASA.
- "Antarctica study challenges warming skeptics". NBC News. 21 January 2009. Retrieved 2 May 2019.
- "Archived copy". Archived from the original on 6 July 2015. Retrieved 6 July 2015.CS1 maint: archived copy as title (link)
- "Archived copy". Archived from the original on 24 September 2008. Retrieved 14 August 2008.CS1 maint: archived copy as title (link)
- "NASA - NASA Researchers Find Snowmelt in Antarctica Creeping Inland". nasa.gov. Archived from the original on 1 August 2015.
- IPCC 2007, Intergovernmental Panel on Climate Change, Climate Change 2007: The Physical Science Basis. Contribution of Working Group I to the Fourth Assessment Report of the Intergovernmental Panel on Climate Change Archived 24 September 2015 at the Wayback Machine, Cambridge University Press, 2007, page 376.
- Nicolas, Julien. "Reconstructed Byrd temperature record". polarmet.osu.edu. Archived from the original on 15 December 2016.
- Witze, Alexandra (14 April 2014). "West Antarctica warming fast". Archived from the original on 11 September 2013.
- Bromwich, David H.; Nicolas, Julien P.; Monaghan, Andrew J.; Lazzara, Matthew A.; Keller, Linda M.; Weidner, George A.; Wilson, Aaron B. (2013). "Map of Antarctica and annual spatial footprint of the Byrd temperature record: Central West Antarctica among the most rapidly warming regions on Earth". Nature Geoscience. 6 (2): 139–145. Bibcode:2013NatGe...6..139B. CiteSeerX 10.1.1.394.1974. doi:10.1038/ngeo1671.
- Bromwich, D. H.; Nicolas, J. P.; Monaghan, A. J.; Lazzara, M. A.; Keller, L. M.; Weidner, G. A.; Wilson, A. B. (2012). "Central West Antarctica among the most rapidly warming regions on Earth". Nature Geoscience. 6 (2): 139–145. Bibcode:2013NatGe...6..139B. CiteSeerX 10.1.1.394.1974. doi:10.1038/ngeo1671.
Sources
- D. G. Vaughan; G. J. Marshall; W. M. Connolley; J. C. King; R. M. Mulvaney (2001). "Devil in the detail". Science. 293 (5536): 1777–9. doi:10.1126/science.1065116. PMID 11546858.
- M.J. Bentley; D.A. Hodgson; D.E. Sugden; S.J. Roberts; J.A. Smith; M.J. Leng; C. Bryant (2005). "Early Holocene retreat of the George VI Ice Shelf, Antarctic Peninsula". Geology. 33 (3): 173–6. Bibcode:2005Geo....33..173B. doi:10.1130/G21203.1.
Further reading
External links
Climate
- Climate data from Antarctic surface stations with trends
- Temperature data from the READER project
- A pamphlet about the weather and climate of Antarctica
- Antarctica's central ice cap grows while glaciers melt
- "AWS and AMRC Real-Time Weather Observations and Data". University of Wisconsin–Madison's Antarctic Weather Stations Project and Antarctic Meteorological Research Center. Retrieved 31 May 2005.
- Antarctica Climate and Weather
Climate change in Antarctica
Antarctic ice
- "Sea Ice Index – Trends in extent – Southern Hemisphere (Antarctic)". National Snow and Ice Data Center. Retrieved 9 January 2009.
- "Coastal-Change and Glaciological Maps of Antarctica". USGS Fact Sheet 2005–3055. Retrieved 31 May 2005.
- "Coastal-Change and Glaciological Maps of Antarctica". USGS Fact Sheet 050–98. Retrieved 28 February 2005.
- "Coastal-change and glaciological map of the Eights Coast area, Antarctica; 1972–2001". U.S. Geological Survey Scientific Investigations Series Map, I-2600-E. Retrieved 28 February 2005.
- "Coastal-change and glaciological map of the Bakutis Coast area, Antarctica; 1972–2002". U.S. Geological Survey Scientific Investigations Series Map, I-2600-F. Retrieved 28 February 2005.
- "Coastal-change and glaciological map of the Saunders Coast area, Antarctica; 1972–1997". U.S. Geological Survey Scientific Investigations Series Map, I-2600-G. Retrieved 28 February 2005.
- "Satellite Image Atlas of Glaciers of the World – Antarctica". U.S. Geological Survey Professional Paper 1386-B. Retrieved 28 February 2005.
| General |
| .svg.png) |
|---|---|---|
| Geographic regions |
| |
| Waterways |
| |
| Famous explorers |
| |
| ||