Tampakan, South Cotabato
Tampakan, officially the Municipality of Tampakan, is a 2nd class municipality in the province of South Cotabato, Philippines. According to the 2015 census, it has a population of 39,525 people.[3]
Tampakan | |
|---|---|
| Municipality of Tampakan | |
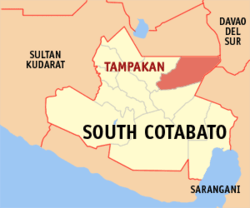 Map of South Cotabato with Tampakan highlighted | |
| |
.svg.png) Tampakan Location within the Philippines | |
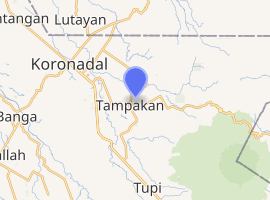
| Coordinates: 6°27′N 124°56′E | |
| Country | |
| Region | Soccsksargen (Region XII) |
| Province | South Cotabato |
| District | 1st District |
| Barangays | 14 (see Barangays) |
| Government | |
| • Type | Sangguniang Bayan |
| • Mayor | Leonard T. Escobillo |
| • Vice Mayor | John Mark C. Baldon |
| • Electorate | 26,995 voters (2019) |
| Area | |
| • Total | 390.00 km2 (150.58 sq mi) |
| Elevation | 134.8 m (442.3 ft) |
| Population (2015 census)[3] | |
| • Total | 39,525 |
| • Density | 100/km2 (260/sq mi) |
| • Households | 9,391 |
| Economy | |
| • Income class | 2nd municipal income class |
| • Poverty incidence | 36.55% (2015)[4] |
| • Revenue (₱) | 137,545,355.70 (2016) |
| Time zone | UTC+8 (PST) |
| ZIP code | 9507 |
| PSGC | |
| IDD : area code | +63 (0)83 |
| Climate type | tropical rainforest climate |
| Native languages | Hiligaynon Cebuano Maguindanao language Kalagan language Tagalog |
| Website | tampakanscot |
Barangays
Tampakan is politically subdivided into 14 barangays.
- Albagan
- Buto
- Danlag
- Kipalbig
- Lambayong
- Liberty
- Lampitak
- Maltana
- Poblacion
- Palo
- Pula Bato
- San Isidro
- Santa Cruz
- Tablu
Climate
| Climate data for Tampakan, South Cotabato | |||||||||||||
|---|---|---|---|---|---|---|---|---|---|---|---|---|---|
| Month | Jan | Feb | Mar | Apr | May | Jun | Jul | Aug | Sep | Oct | Nov | Dec | Year |
| Average high °C (°F) | 23 (73) |
23 (73) |
24 (75) |
24 (75) |
23 (73) |
22 (72) |
22 (72) |
22 (72) |
22 (72) |
22 (72) |
22 (72) |
23 (73) |
23 (73) |
| Average low °C (°F) | 15 (59) |
15 (59) |
15 (59) |
16 (61) |
17 (63) |
17 (63) |
16 (61) |
16 (61) |
16 (61) |
16 (61) |
16 (61) |
16 (61) |
16 (61) |
| Average precipitation mm (inches) | 54 (2.1) |
41 (1.6) |
56 (2.2) |
81 (3.2) |
154 (6.1) |
212 (8.3) |
223 (8.8) |
218 (8.6) |
192 (7.6) |
184 (7.2) |
135 (5.3) |
73 (2.9) |
1,623 (63.9) |
| Average rainy days | 10.4 | 9.1 | 11.2 | 14.4 | 24.6 | 27.0 | 26.7 | 26.1 | 25.6 | 26.9 | 22.6 | 15.1 | 239.7 |
| Source: Meteoblue [5] | |||||||||||||
Demographics
| Population census of Tampakan | ||
|---|---|---|
| Year | Pop. | ±% p.a. |
| 1970 | 10,731 | — |
| 1975 | 15,867 | +8.16% |
| 1980 | 18,057 | +2.62% |
| 1990 | 32,373 | +6.01% |
| 1995 | 28,256 | −2.52% |
| 2000 | 33,011 | +3.39% |
| 2007 | 34,245 | +0.51% |
| 2010 | 36,254 | +2.10% |
| 2015 | 39,525 | +1.66% |
| Source: Philippine Statistics Authority[3][6][7][8] | ||
References
- "Municipality". Quezon City, Philippines: Department of the Interior and Local Government. Retrieved 31 May 2013.
- "Province: South Cotabato". PSGC Interactive. Quezon City, Philippines: Philippine Statistics Authority. Retrieved 12 November 2016.
- Census of Population (2015). "Region XII (Soccsksargen)". Total Population by Province, City, Municipality and Barangay. PSA. Retrieved 20 June 2016.
- "PSA releases the 2015 Municipal and City Level Poverty Estimates". Quezon City, Philippines. Retrieved 12 October 2019.
- "Tampakan: Average Temperatures and Rainfall". Meteoblue. Retrieved 15 May 2020.
- Census of Population and Housing (2010). "Region XII (Soccsksargen)". Total Population by Province, City, Municipality and Barangay. NSO. Retrieved 29 June 2016.
- Censuses of Population (1903–2007). "Region XII (Soccsksargen)". Table 1. Population Enumerated in Various Censuses by Province/Highly Urbanized City: 1903 to 2007. NSO.
- "Province of South Cotabato". Municipality Population Data. Local Water Utilities Administration Research Division. Retrieved 17 December 2016.
External links
Places adjacent to Tampakan, South Cotabato | ||||||||||
|---|---|---|---|---|---|---|---|---|---|---|
| ||||||||||
Koronadal (capital) | |
| Municipalities | |
| Component City | |
| Highly Urbanized City |
|
This article is issued from Wikipedia. The text is licensed under Creative Commons - Attribution - Sharealike. Additional terms may apply for the media files.