Sweden (European Parliament constituency)
For elections in the European Union, Sweden is a European Parliament constituency covering the entire nation of Sweden. It is currently represented by twenty MEPs.
| Sweden | |
|---|---|
| European Parliament constituency | |
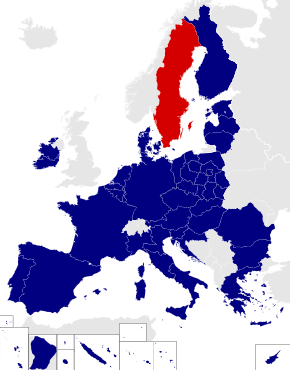 Location among the current constituencies | |
| Member state | Sweden |
| Created | 1995 |
| MEPs | 22 (1995–2004) 19 (2004–2009) 18 (2009–2011) 20 (2011–present) |
| Sources | |
Current MEPs
As of April 2015
| Name | National party | EP group |
|---|---|---|
| Marita Ulvskog | Social Democrats | S&D |
| Jytte Guteland | Social Democrats | S&D |
| Olle Ludvigsson | Social Democrats | S&D |
| Jens Nilsson | Social Democrats | S&D |
| Anna Hedh | Social Democrats | S&D |
1995

The map shows which European party group received the most votes in each municipality in 1995.
Austria, Finland and Sweden acceded to the Union on 1 January 1995. 59 delegates (21 from Austria, 16 from Finland, 22 from Sweden) were appointed to the Parliament on accession, bringing the total up to 626. Elections to elect the 22 MEPs for Sweden were held on 17 September 1995.[1][2]
| 1995 • 1999 → | |||||||||
| National party | European party | Main candidate | Votes | % | +/– | Seats | +/– | ||
|---|---|---|---|---|---|---|---|---|---|
| Social Democratic Party (S) | PES | Maj-Britt Theorin Maj-Lis Lööw |
752,817 | 28.06 | — | 7 | — | ||
| Moderate Party (M) | EPP | Staffan Burenstam Linder | 621,568 | 23.17 | — | 5 | — | ||
| Green Party (MP) | G | Per Gahrton | 462,092 | 17.22 | — | 4 | — | ||
| Left Party (V) | GUE/NGL | Jonas Sjöstedt | 346,764 | 12.92 | — | 3 | — | ||
| Centre Party (C) | ELDR | Karl Erik Olsson | 192,077 | 7.16 | — | 2 | — | ||
| Liberal People's Party (FP) | ELDR | Hadar Cars | 129,376 | 4.82 | — | 1 | — | ||
| Christian Democrats (KD) | EPP | Holger Gustafsson | 105,173 | 3.92 | — | 0 | — | ||
| Sarajevo List (SL) | 26,875 | 1.00 | — | 0 | — | ||||
| Others (parties that won less than 1% of the vote and no seats) | 46,409 | — | 0 | — | |||||
| Valid votes | 2,683,151 | 98.38 | |||||||
| Blank and invalid votes | 44,166 | 1.62 | |||||||
| Totals | 2,727,317 | 100.00 | — | 22 | — | ||||
| Electorate (eligible voters) and voter turnout | 6,551,781 | 41.63 | — | ||||||
| Source:[3] | |||||||||
1999

The map shows which European party group received the most votes in each municipality in 1999.
The 1999 European election was the fifth election to the European Parliament.
| ← 1995 • 1999 • 2004 → | |||||||||
| National party | European party | Main candidate | Votes | % | +/– | Seats | +/– | ||
|---|---|---|---|---|---|---|---|---|---|
| Social Democratic Party (S) | Pierre Schori | 657,497 | 25.99 | 2.07 |
6 / 22 |
1 | |||
| Moderate Party (M) | Staffan Burenstam Linder | 524,755 | 20.75 | 2.42 |
5 / 22 |
0 | |||
| Left Party (V) | Jonas Sjöstedt | 400,073 | 15.82 | 2.90 |
3 / 22 |
0 | |||
| Liberal People's Party (FP) | Marit Paulsen | 350,339 | 13.85 | 9.03 |
3 / 22 |
2 | |||
| Green Party (MP) | Per Gahrton | 239,946 | 9.49 | 7.73 |
2 / 22 |
2 | |||
| Christian Democrats (KD) | Anders Wijkman | 193,354 | 7.64 | 3.72 |
2 / 22 |
2 | |||
| Centre Party (C) | Karl Olsson | 151,442 | 5.99 | 1.17 |
1 / 22 |
1 | |||
| Others (parties that won less than 1% of the vote and no seats) | 12,031 | 0.5 | — | 0 / 22 |
— | ||||
| Valid votes | 2,529,437 | 97.72 | |||||||
| Blank and invalid votes | 59,077 | 2.28 | |||||||
| Totals | 2,588,514 | 100.00 | — | 22 / 22 |
0 | ||||
| Electorate (eligible voters) and voter turnout | 6,664,205 | 38.84 | 2.79 |
||||||
2004

The map shows which European party group received the most votes in each municipality in 2004.
The 2004 European election was the sixth election to the European Parliament and the third for Sweden.
| ← 1999 • 2004 • 2009 → | |||||||||
| National party | European party | Main candidate | Votes | % | +/– | Seats | +/– | ||
|---|---|---|---|---|---|---|---|---|---|
| Social Democratic Party (S) | PES | Inger Segelström | 616,963 | 24.56 | 1.43 |
5 / 19 |
1 | ||
| Moderate Party (M) | EPP | Gunnar Hökmark | 458,398 | 18.25 | 2.50 |
4 / 19 |
1 | ||
| June List (JL) | EUD | Nils Lundgren | 363,472 | 14.47 | new | 3 / 19 |
3 | ||
| Left Party (V) | NGLA | Jonas Sjöstedt | 321,344 | 12.79 | 3.03 |
2 / 19 |
1 | ||
| Liberal People's Party (FP) | ELDR | Cecilia Malmström | 247,750 | 9.86 | 3.99 |
2 / 19 |
1 | ||
| Centre Party (C) | ELDR | Lena Ek | 157,258 | 6.26 | 0.27 |
1 / 19 |
0 | ||
| Green Party (MP) | EGP | Carl Schlyter | 149,603 | 5.96 | 3.53 |
1 / 19 |
1 | ||
| Christian Democrats (KD) | EPP | Anders Wijkman | 142,704 | 5.68 | 1.96 |
1 / 19 |
1 | ||
| Sweden Democrats (SD) | None | Sten Andersson | 28,303 | 1.13 | 0.8 |
0 / 19 |
0 | ||
| Others (parties that won less than 1% of the vote and no seats) | 0 / 19 |
0 | |||||||
| Valid votes | 2,512,069 | ||||||||
| Blank and invalid votes | 72,395 | ||||||||
| Totals | 2,584,464 | 100.00 | — | 19 / 19 |
3 | ||||
| Electorate (eligible voters) and voter turnout | 6,827,870 | 37.85 | 0.99 |
||||||
| Source: Official results | |||||||||
2009
| ← 2004 • 2009 • 2014 → | ||||||||||
| National party | European party | Main candidate | Votes | % | +/– | Seats | +/– | Seats (post-Lisbon) | +/– | |
|---|---|---|---|---|---|---|---|---|---|---|
| Social Democratic (S) | PES | Marita Ulvskog | 773,513 | 24.41 | 0.15 |
5 / 18 | 0 |
6 / 20 | 1 | |
| Moderate (M) | EPP | Gunnar Hökmark | 596,710 | 18.83 | 0.58 |
4 / 18 | 0 |
4 / 20 | 0 | |
| Liberal People's (FP) | ELDR | Marit Paulsen | 430,385 | 13.58 | 3.72 |
3 / 18 | 1 |
3 / 20 | 0 | |
| Green (MP) | EGP | Carl Schlyter | 349,114 | 11.02 | 5.06 |
2 / 18 | 1 |
2 / 20 | 0 | |
| Pirate (PP) | None | Christian Engström | 225,915 | 7.13 | new | 1 / 18 | 1 |
2 / 20 | 1 | |
| Left (V) | NGLA | Eva-Britt Svensson | 179,182 | 5.66 | 7.14 |
1 / 18 | 1 |
1 / 20 | 0 | |
| Centre (C) | ELDR | Lena Ek | 173,414 | 5.47 | 0.79 |
1 / 18 | 0 |
1 / 20 | 0 | |
| Christian Democrats (KD) | EPP | Ella Bohlin | 148,141 | 4.68 | 1.01 |
1 / 18 | 0 |
1 / 20 | 0 | |
| June List (JL) | EUD | Sören Wibe | 112,355 | 3.55 | 10.92 |
0 / 18 | 3 |
0 / 20 | 0 | |
| Sweden Democrats (SD) | None | Sven-Olof Sällström | 103,584 | 3.27 | 2.14 |
0 / 18 | 0 |
0 / 20 | 0 | |
| Feminist Initiative | None | Gudrun Schyman | 70,434 | 2.22 | new | 0 / 18 | 0 |
0 / 20 | 0 | |
| Others (parties or candidates that won less than 1% of the vote and no seats) | 5,799 | 0.18 | — | 0 / 18 | 0 |
0 / 20 | 0 | |||
| Valid votes | 3,168,546 | 98.17 | ||||||||
| Blank and invalid votes | 59,015 | 1.83 | ||||||||
| Totals | 3,227,561 | 100.00 | — | 18 / 18 |
1 |
20 / 20 |
2 | |||
| Electorate (eligible voters) and voter turnout | 7,088,303 | 45.53 | 7.68 |
|||||||
| Source: Val.se | ||||||||||
References
- Val-och-valdeltagande Archived 20 October 2008 at the Wayback Machine on the EU Upplysningen website from the Swedish Parliament
- eng_faktablad_4_080206_webb.pdf Archived 24 May 2011 at the Wayback Machine on the EU Upplysningen website from the Swedish Parliament
- "Val till EU-parlamentet 1995" (in Swedish). Lars Alexandersson, Department of Mathematics, Linköping University. Archived from the original on 20 September 2014. Retrieved 6 December 2008.
External links
- European Election News by European Election Law Association (Eurela)
- List of MEPs europarl.europa.eu
This article is issued from Wikipedia. The text is licensed under Creative Commons - Attribution - Sharealike. Additional terms may apply for the media files.