Stakeholder analysis
Stakeholder analysis (in conflict resolution, business administration, environmental health sciences decision making,[1] Industrial ecology, and project management) is the process of assessing a system and potential changes to it as they relate to relevant and interested parties (stakeholders). This information is used to assess how the interests of those stakeholders should be addressed in a project plan, policy, program, or other action.[2] Stakeholder analysis is a key part of stakeholder management. A stakeholder analysis of an issue consists of weighing and balancing all of the competing demands on a firm by each of those who have a claim on it, in order to arrive at the firm's obligation in a particular case. A stakeholder analysis does not preclude the interests of the stakeholders overriding the interests of the other stakeholders affected, but it ensures that all affected will be considered.[3]
Stakeholder analysis is frequently used during the preparation phase of a project to assess the attitudes of the stakeholders regarding the potential changes. Stakeholder analysis can be done once or on a regular basis to track changes in stakeholder attitudes over time.
Stakeholder types
Types of stakeholders include:[4]
- Primary stakeholders: those ultimately most affected, either positively or negatively by an organization's actions
- Secondary stakeholders: the "intermediaries," that is, persons or organizations who are indirectly affected by an organization's actions
- Tertiary stakeholders: those who will be impacted the least
Other types of stakeholders:
- Key stakeholders: those with significant influence upon or importance within an organization; can also belong to the other groups
Stakeholder mapping

The following list identifies some of the best known and most commonly used methods for stakeholder mapping:
- Cameron et al. defined a process for ranking stakeholders based on needs and the relative importance of stakeholders to others in the network.[5]
- Fletcher et al. defined a process for mapping stakeholder expectations based on value hierarchies and key performance indicators.[6]
- Mitchell et al. proposed a classification of stakeholders based on power to influence, the legitimacy of each stakeholder's relationship with the organization, and the urgency of the stakeholder's claim on the organization. The results of this classification may assess the fundamental question of "which groups are stakeholders deserving or requiring manager's attention, and which are not?" This is salience - "the degree to which managers give priority to competing stakeholder claims."[7]
- Savage et al. offer a way to classify stakeholders according to potential for threat and potential for cooperation.[8]
- Turner et al. have developed a process of identification, assessment of awareness, support, and influence, leading to strategies for communicating and assessing stakeholder satisfaction, and determining who is aware or ignorant and whether their attitude is supportive or opposing.[9]
Mapping techniques include the following analysis techniques being used by aid agencies, governments, or consultant groups:
- Lynda Bourne's Stakeholder Circle, "a five-step methodology that provides a flexible approach to understanding and managing the relationships within and around the activity",[10] involves identification, prioritization, visualization, engagement, and monitoring of stakeholder aspects
- Mendelow's power-interest grid, which considers stakeholder "power and expectations (and therefore their likely interest) ... to determine the potential influence of stakeholder groups"[11]
- Murray-Webster and Simon's three-dimensional grid mapping power, interest, and attitude, for better "stimulating thought and informing the project or program manager in a truly meaningful way"[12]
- Imperial College London's influence-interest grid, "plotting stakeholders on a graph in terms of their influence over the project and their interest in the project"[13]
- The former Office of Government Commerce's power-impact grid, mapping "the level of impact of the change on [stakeholder] and the importance these stakeholders [have] to the success of the change project"[14]
Stakeholder mapping procedure
The list of potential stakeholders for any project often exceeds both the time available for analysis and the capability to sensibly map and display the results.[15]The challenge is to focus on the right stakeholders who are currently important and to create a visual representation of this critical sub-set of the total community - the key stakeholders.[15]
The power-interest matrix
The most common presentation style uses a two-dimensional matrix. Power and influence are commonly seen with a third dimension shown by the colour or size of the symbol representing the individual stakeholders, often the attitude.
Some of the commonly used dimensions include:[4][11][12][13][14][16]
- Power (high, medium, low)
- Influence (high or low)
- Interest/Need (high, medium, low)
- Support/Attitude (positive, neutral, negative)
The salience model
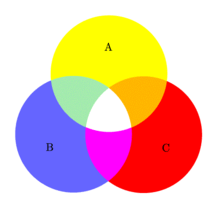
The salience model[7] uses three dimensions: legitimacy (A), power (B), and urgency (C). It is represented in a Venn diagram, that has 8 regions each associated to a specific stakeholder type.[17]
Stakeholder types as described by the salience model:
- Discretionary stakeholders: These stakeholders have little urgency or power and are unlikely to exert much pressure. They have legitimate claims. (yellow region)
- Dormant stakeholders: These stakeholders have much power but no legitimacy or urgency and therefore are not likely to become heavily involved. (blue region)
- Demanding stakeholders: These stakeholders have little power or legitimacy but can make much "noise" because they want things to be addressed immediately. (red region)
- Dominant stakeholders: These stakeholders have both formal power and legitimacy, but little urgency. They are tend to have certain expectations that must be met. (green region)
- Dangerous stakeholders: These stakeholders have power and urgency but are not really pertinent to the project. (purple region)
- Dependent stakeholders: These stakeholders have urgent and legitimate stakes in the project but little power. These stakeholders may lean on another stakeholder group to have their voices heard. (orange region)
- Definitive stakeholders: These stakeholders have power, legitimacy and urgency and therefore have the highest salience. (white region at the intersection of all other regions)
- Non-stakeholders: These stakeholders have no power, legitimacy or urgency. (outside the regions defined by the circles A, B, and C)
Benefits
Stakeholder analysis helps with the identification of:[16][18][19]
- Stakeholders' interests
- Potential risks and misunderstandings
- Mechanisms to positively influence other stakeholders
- Key people to be informed about the project during the execution phase
- Negative stakeholders as well as their adverse effects on the project
See also
References
- Coble, Yank; Coussens, Christine; Quinn, Kathleen, eds. (2009). "4. Stakeholder Perspectives on Environmental Health Sciences Decision Making". Environmental Health Sciences Decision Making: Risk Management, Evidence, and Ethics - Workshop Summary. Washington, D.C.: The National Academies Press. doi:10.17226/12444. ISBN 978-0-309-12454-6. PMID 21210552.
- Ketema, D.M.; Chisholm, N.; Enright, P. (2017). "Chapter 20: Examining the Characteristics of Stakeholders in Lake Tana Sub-basin Resource Use, Management and Governance". In Stave, K.; Goshu, G.; Aynalem, S. (eds.). Social and Ecological System Dynamics. Springer. p. 318. ISBN 9783319457550.
- DeGeorge, R.T. (2010). Business Ethics. Pearson Education, Inc. p. 192. ISBN 9780205015108.
- De Mascia, S. (2016). Project Psychology: Using Psychological Models and Techniques to Create a Successful Project. CRC Press. pp. 73–74. ISBN 9781317075011.
- Cameron, B.G.; Seher, T.; Crawley, E.F. (2011). "Goals for space exploration based on stakeholder value network considerations". Acta Astronautica. 68 (11–12): 2088–97. Bibcode:2011AcAau..68.2088C. doi:10.1016/j.actaastro.2010.11.003.
- Fletcher, A.; Guthrie, J.; Steane, P.; et al. (2003). "Mapping stakeholder perceptions for a third sector organization". Journal of Intellectual Capital. 4 (4): 505–27. doi:10.1108/14691930310504536.
- Mitchell, R.K.; Agle, B.R.; Wood, D.J. (1997). "Toward a Theory of Stakeholder Identification and Salience: Defining the Principle of Who and What Really Counts". The Academy of Management Review. 22 (4): 853–86. doi:10.2307/259247. JSTOR 259247.
- Savage, G.T.; Nix, T.W.; Whitehead, C.J.; Blair, J.D. (1991). "Strategies for Assessing and Managing Organizational Stakeholders". The Executive. 5 (2): 61–75. JSTOR 4165008.
- Turner, J.R.; Grude, K.V.; Thurloway, L. (1999). The Project Manager As Change Agent: Leadership, Influence and Negotiation. McGraw-Hill Book Co Ltd. ISBN 9780077077419.
- Bourne, L. (2012). Stakeholder Relationship Management: A Maturity Model for Organisational Implementation. Gower Publishing, Ltd. p. PT61. ISBN 9780566091933.
- Botten, N. (2006). Management Accounting - Business Strategy. CIMA Publishing. pp. 3–4. ISBN 9780750680431.
Once the power and expectations (and therefore their likely interest) has been established we can use a power interest matrix to assist the analysis. Mendelow (1991) has proposed such a matrix (Figure 1.4). If the stakeholders are plotted regularly this matrix can be used to determine the potential influence of stakeholder groups.
- Murray-Webster, R.; Simon, P. (2006). "Making Sense of Stakeholder Mapping" (PDF). PM World Today. 8 (11): 1–4.
- "Stakeholder management" (PDF). Imperial College London. 21 June 2017. Retrieved 6 July 2018.
- "Stakeholder Management Plan" (PDF). Office of Government Commerce. 2006. Archived from the original (PDF) on 20 June 2008. Retrieved 6 July 2018.
- Eden, C.; Ackermann, F. (2013). Making Strategy: The Journey of Strategic Management. SAGE. p. 123. ISBN 9781446265192.
- Babou, S. (12 March 2008). "What Is Stakeholder Analysis?". The Project Management Hut. PM Hut. Archived from the original on 22 February 2015. Retrieved 6 July 2018.
- Lemiejux, Normand (2019-09-11). "Stakeholder Analysis: Definitions, Tools and Techniques". Boréalis. Retrieved 2019-10-01.
- Kimmich, C.; Janetschek, H.; Meyer-Ohlendorf, L.; et al. (2012). Methods for Stakeholder Analysis. Europaeischer Hochschulverlag GmbH & Co KG. pp. 3–4. ISBN 9783867417808.
- Dwyer, J.; Hopwood, N. (2013). Management Strategies and Skills. McGraw-Hill Education Australia. p. 360. ISBN 9781743764930.