Sinusoidal projection
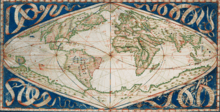
The sinusoidal projection is a pseudocylindrical equal-area map projection, sometimes called the Sanson–Flamsteed or the Mercator equal-area projection. Jean Cossin of Dieppe was one of the first mapmakers to use the sinusoidal, appearing in a world map of 1570.[1]
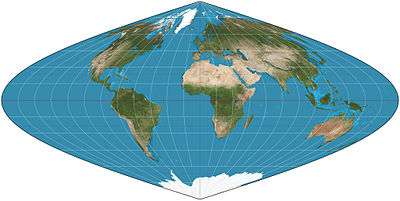
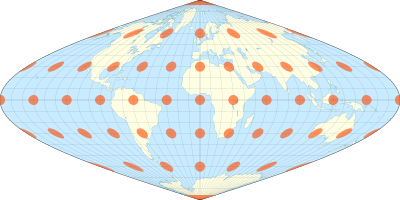
The projection represents the poles as points, as they are on the sphere, but the meridians and continents are distorted. The equator and the prime meridian are the most accurate parts of the map, having no distortion at all, and the further away from those that one examines, the greater the distortion.[2]
The projection is defined by:

where is the latitude, λ is the longitude, and λ0 is the longitude of the central meridian.[3]

Scale is constant along the central meridian, and east–west scale is constant throughout the map. Therefore, the length of each parallel on the map is proportional to the cosine of the latitude, as it is on the globe. This makes the left and right bounding meridians of the map into half of a sine wave, each mirroring the other. Each meridian is half of a sine wave with only the amplitude differing, giving the projection its name. Each is shown on the map as longer than the central meridian, whereas on the globe all are the same length.
The true distance between two points on a meridian can be measured on the map as the vertical distance between the parallels that intersect the meridian at those points. With no distortion along the central meridian and the equator, distances along those lines are correct, as are the angles of intersection of other lines with those two lines. Distortion is lowest throughout the region of the map close to those lines.

Similar projections which wrap the east and west parts of the sinusoidal projection around the north pole are the Werner and the intermediate Bonne and Bottomley projections.
The MODLAND Integerized Sinusoidal Grid, based on the sinusoidal projection, is a geodesic grid developed by the NASA's Moderate-Resolution Imaging Spectroradiometer (MODIS) science team.[4]
See also
- List of map projections
- Gerardus Mercator, Nicolas Sanson, and John Flamsteed – mathematicians who developed the technique.
References
- Jean Cossin, Carte cosmographique ou Universelle description du monde avec le vrai traict des vents, 1570.
- "Finally, a World Map That Doesn't Lie". D-brief. 2016-11-03. Retrieved 2019-07-01.
- Map Projections—A Working Manual, USGS Professional Paper 1395, John P. Snyder, 1987, pp. 243–248
- NASA: "MODLAND Integerized Sinusoidal Grid"
External links

- Pseudocylindrical Projections
- Table of examples and properties of all common projections, from radicalcartography.net