San Pablo, Isabela
San Pablo (Ibanag: Ili nat San Pablo; Ilocano: Ili ti San Pablo; Tagalog: Bayan ng San Pablo), officially the Municipality of San Pablo, is a 2nd class municipality in the province of Isabela, Philippines. According to the 2015 census, it has a population of 25,384 people.[3]
San Pablo | |
|---|---|
| Municipality of San Pablo | |
 San Pablo de Cabigan Church Ruin | |
 Seal | |
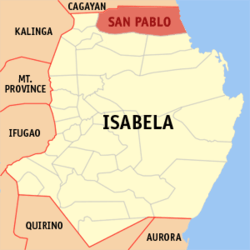 Map of Isabela with San Pablo highlighted | |

| |
.svg.png) San Pablo Location within the Philippines | |
| Coordinates: 17°28′59″N 121°59′16″E | |
| Country | |
| Region | Cagayan Valley (Region II) |
| Province | Isabela |
| District | 1st District of Isabela |
| Barangays | 17 (see Barangays) |
| Government | |
| • Type | Sangguniang Bayan |
| • Mayor | Antonio N. Miro, Jr. |
| • Vice Mayor | Antonio Jose T. Miro III |
| • Congressman | Antonio T. Albano |
| • Electorate | 16,206 voters (2019) |
| Area | |
| • Total | 637.90 km2 (246.29 sq mi) |
| Elevation | 40.2 m (131.9 ft) |
| Population (2015 census)[3] | |
| • Total | 25,384 |
| • Density | 40/km2 (100/sq mi) |
| • Households | 5,072 |
| Economy | |
| • Income class | 2nd municipal income class |
| • Poverty incidence | 20.73% (2015)[4] |
| • Revenue (₱) | 133,423,040.80 (2016) |
| Time zone | UTC+8 (PST) |
| ZIP code | 3329 |
| PSGC | |
| IDD : area code | +63 (0)78 |
| Climate type | tropical rainforest climate |
| Native languages | Ibanag Ilocano Tagalog |
| Website | www |
Barangays
San Pablo is politically subdivided into 17 barangays. [2]
- Annanuman
- Auitan
- Ballacayu
- Binguang
- Bungad
- Dalena
- Caddangan/Limbauan
- Calamagui
- Caralucud
- Guminga
- Minanga Norte
- Minanga Sur
- San Jose
- Poblacion
- Simanu Norte
- Simanu Sur
- Tupa (San Vicente)
Demographics
| Population census of San Pablo | |||||||||||||||||||||||||||||||||||||||||||||||||
|---|---|---|---|---|---|---|---|---|---|---|---|---|---|---|---|---|---|---|---|---|---|---|---|---|---|---|---|---|---|---|---|---|---|---|---|---|---|---|---|---|---|---|---|---|---|---|---|---|---|
|
| ||||||||||||||||||||||||||||||||||||||||||||||||
| Source: Philippine Statistics Authority[3][5][6][7] | |||||||||||||||||||||||||||||||||||||||||||||||||
In the 2015 census, the population of San Pablo, Isabela, was 25,384 people,[3] with a density of 40 inhabitants per square kilometre or 100 inhabitants per square mile.
Climate
| Climate data for San Pablo, Isabela | |||||||||||||
|---|---|---|---|---|---|---|---|---|---|---|---|---|---|
| Month | Jan | Feb | Mar | Apr | May | Jun | Jul | Aug | Sep | Oct | Nov | Dec | Year |
| Average high °C (°F) | 29 (84) |
30 (86) |
32 (90) |
35 (95) |
35 (95) |
35 (95) |
34 (93) |
33 (91) |
32 (90) |
31 (88) |
30 (86) |
28 (82) |
32 (90) |
| Average low °C (°F) | 19 (66) |
20 (68) |
21 (70) |
23 (73) |
23 (73) |
24 (75) |
23 (73) |
23 (73) |
23 (73) |
22 (72) |
21 (70) |
20 (68) |
22 (71) |
| Average precipitation mm (inches) | 31.2 (1.23) |
23 (0.9) |
27.7 (1.09) |
28.1 (1.11) |
113.5 (4.47) |
141.4 (5.57) |
176.4 (6.94) |
236.6 (9.31) |
224.9 (8.85) |
247.7 (9.75) |
222.9 (8.78) |
178 (7.0) |
1,651.4 (65) |
| Average rainy days | 10 | 6 | 5 | 5 | 13 | 12 | 15 | 15 | 15 | 17 | 16 | 15 | 144 |
| Source: World Weather Online[8] | |||||||||||||
References
- "Municipality". Quezon City, Philippines: Department of the Interior and Local Government. Retrieved 31 May 2013.
- "Province: Isabela". PSGC Interactive. Quezon City, Philippines: Philippine Statistics Authority. Retrieved 12 November 2016.
- Census of Population (2015). "Region II (Cagayan Valley)". Total Population by Province, City, Municipality and Barangay. PSA. Retrieved 20 June 2016.
- "PSA releases the 2015 Municipal and City Level Poverty Estimates". Quezon City, Philippines. Retrieved 1 January 2020.
- Census of Population and Housing (2010). "Region II (Cagayan Valley)". Total Population by Province, City, Municipality and Barangay. NSO. Retrieved 29 June 2016.
- Censuses of Population (1903–2007). "Region II (Cagayan Valley)". Table 1. Population Enumerated in Various Censuses by Province/Highly Urbanized City: 1903 to 2007. NSO.
- "Province of Isabela". Municipality Population Data. Local Water Utilities Administration Research Division. Retrieved 17 December 2016.
- "San Pablo, Isabela: Average Temperatures and Rainfall". World Weather Online. Retrieved 3 November 2015.
External links
- San Pablo Profile at PhilAtlas.com
- Municipal Profile at the National Competitiveness Council of the Philippines
- San Pablo at the Isabela Government Website
- Local Governance Performance Management System
- Philippine Standard Geographic Code
- Philippine Census Information
- Municipality of San Pablo
Places adjacent to San Pablo, Isabela | ||||||||||
|---|---|---|---|---|---|---|---|---|---|---|
| ||||||||||
Ilagan (capital) | |
| Municipalities |
|
| Component Cities | |
| Independent Component City |
|
| Barangays | See: List of barangays in Isabela |
| Authority control |
|
|---|
This article is issued from Wikipedia. The text is licensed under Creative Commons - Attribution - Sharealike. Additional terms may apply for the media files.