Romance-speaking world
The Romance-speaking world,[1][2] romanophone,[3][4] neolatin world,[5] or Latin-speaking world,[6] is the part of the world where Romance languages (those evolved from Latin) are either official, co-official, or significantly used, comprising the Latin Europe, Latin America, as well as parts of North America and Romance-speaking Africa and Romance-speaking Asia.
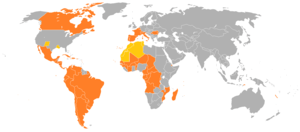
Romance languages-speaking countries
It includes, for example, the Spanish-, Portuguese-, French-, Italian-, Romanian- and Catalan-speaking communities.
Area, population and GDP of the Romance-speaking world
Spanish-speaking countries
| Country | Area, km² [7] | Population (2014) [8] | GDP (nominal), millions of US$ (2014) [9] | |
|---|---|---|---|---|
| 1 | 2,780,400 | 43,024,374 | 540,200 | |
| 2 | 1,964,375 | 120,286,655 | 1,283,000 | |
| 3 | 1,285,216 | 30,147,935 | 202,900 | |
| 4 | 1,138,914 | 46,245,297 | 384,900 | |
| 5 | 1,098,581 | 10,631,486 | 34,430 | |
| 6 | 916,445 | 28,868,486 | 205,800 | |
| 7 | 756,102 | 17,363,894 | 256,000 | |
| 8 | 505,370 | 47,737,941 | 1,407,000 | |
| 9 | 406,752 | 6,703,860 | 29,700 | |
| 10 | 283,561 | 15,654,411 | 100,800 | |
| 11 | 266,000 | 100,000 or 502,585 | ||
| 12 | 176,215 | 3,332,972 | 55,140 | |
| 13 | 130,370 | 5,848,641 | 11,710 | |
| 14 | 112,090 | 8,598,561 | 19,510 | |
| 15 | 110,860 | 11,047,251 | 77,150 | |
| 16 | 108,889 | 14,647,083 | 60,420 | |
| 17 | 75,420 | 3,608,431 | 43,780 | |
| 18 | 51,100 | 4,755,234 | 48,140 | |
| 19 | 48,670 | 10,349,741 | 64,080 | |
| 20 | 28,051 | 722,254 | 14,310 | |
| 21 | 21,041 | 6,125,512 | 25,310 | |
| 22 | 13,790 | 3,620,897 | 61,460 | |
| Total | 12,278,212 | 439,320,916 | 4,925,740 |
Portuguese-speaking countries
| Country | Area, km² [7] | Population (2014) [8] | GDP (nominal), millions of US$ (2014) [9] | |
|---|---|---|---|---|
| 1 | 8,515,770 | 202,656,788 | 2,353,000 | |
| 2 | 1,246,700 | 19,088,106 | 128,600 | |
| 3 | 799,380 | 24,692,144 | 16,680 | |
| 4 | 92,090 | 10,813,834 | 230,000 | |
| 5 | 36,125 | 1,693,398 | 1,024 | |
| 6 | 28,051 | 722,254 | 14,310 | |
| 7 | 14,874 | 1,201,542 | 4,478 | |
| 8 | 4,033 | 538,535 | 1,899 | |
| 9 | 964 | 190,428 | 341 | |
| 10 | 115 | 667,400 | ||
| Total | 10,709,043 | 260,874,775 | 2,736,022 |
French-speaking countries
| Country | Area, km² [7] | Population (2014) [8] | GDP (nominal), millions of US$ (2014) [9] | |
|---|---|---|---|---|
| 1 | 9,984,670 | 35,099,836 | 1,573,000 | |
| 2 | 2,344,858 | 79,375,136 | 39,060 | |
| 3 | 1,284,000 | 11,631,456 | 11,690 | |
| 4 | 1,267,000 | 18,045,729 | 7,119 | |
| 5 | 1,240,192 | 16,955,536 | 10,950 | |
| 6 | 643,801 | 66,553,766 | 2,423,000 | |
| 7 | 622,984 | 5,391,539 | 1,624 | |
| 8 | 587,041 | 23,812,681 | 9,514 | |
| 9 | 475,440 | 23,739,218 | 28,520 | |
| 10 | 342,000 | 4,755,097 | 8,871 | |
| 11 | 322,463 | 23,295,302 | 31,270 | |
| 12 | 267,667 | 1,705,336 | 13,800 | |
| 13 | 274,200 | 18,931,686 | 11,320 | |
| 14 | 245,857 | 11,780,162 | 6,733 | |
| 15 | 196,722 | 13,975,834 | 13,990 | |
| 16 | 112,622 | 10,448,647 | 7,701 | |
| 17 | 56,785 | 7,552,318 | 4,152 | |
| 18 | 41,277 | 8,121,830 | 677,000 | |
| 19 | 30,528 | 11,323,973 | 458,700 | |
| 20 | 28,051 | 722,254 | 14,310 | |
| 21 | 27,830 | 10,742,276 | 2,970 | |
| 22 | 27,750 | 10,110,019 | 8,797 | |
| 23 | 26,338 | 12,661,733 | 8,468 | |
| 24 | 23,200 | 828,324 | 1,743 | |
| 25 | 18,575 | 224,824 | 11,100 | |
| 26 | 12,189 | 272,264 | 771 | |
| 27 | 4,167 | 282,703 | 7,150 | |
| 28 | 2,586 | 570,252 | 57,930 | |
| 29 | 2,235 | 780,971 | 589 | |
| 30 | 2,040 | 1,265,577 | ||
| 31 | 455 | 92,430 | 1,375 | |
| 32 | 242 | 5,657 | 2,153 | |
| 33 | 142 | 15,613 | 188 | |
| 34 | 116 | 97,294 | 5,771 | |
| 35 | 55 | 140 | 0 | |
| 36 | 54 | 29,376 | 5,615 | |
| 37 | 24 | 7,237 | 179 | |
| 38 | 2 | 30,535 | 6,063 | |
| Total | 20,486,067 | 429,246,730 | 5,451,885 |
Italian-speaking countries
| Country | Area, km² [7] | Population (2014) [8] | GDP (nominal), millions of US$ (2014) [9] | |
|---|---|---|---|---|
| 1 | 301,340 | 61,855,120 | 1,819,000 | |
| 2 | 41,277 | 8,121,830 | 677,000 | |
| 3 | 61 | 33,020 | 1,543 | |
| 4 | 0.44 | 842 | No data | |
| Total | 342,678 | 70,010,812 | 2,497,543 |
Romanian-speaking countries
| Country | Area, km² [7] | Population (2014) [8] | GDP (nominal), millions of US$ (2014) [9] | |
|---|---|---|---|---|
| 1 | 238,391 | 21,666,350 | 177,600 | |
| 2 | 33,851 | 3,546,847 | 6,300 | |
| Total | 272,242 | 25,213,197 | 183,900 |
See also
- Legacy of the Roman Empire
- Latin Union
- Latin America
- Latin Europe
References
- "Language Acquisition in the Romance Speaking World: Peru - Departamento de Educación". Departamento.pucp.edu.pe. Retrieved 2016-05-14.
- "Manual of Language Acquisition - Google Libros". Books.google.es. 2014-08-25. Retrieved 2016-05-14.
- "Multilingualism, Education and Change - Jean Jacques Weber - Google Libros". Books.google.es. Retrieved 2016-05-14.
- "Language in the Media: Representations, Identities, Ideologies - Google Libros". Books.google.es. 2007-09-19. Retrieved 2016-05-14.
- "I nomi dei fiumi, dei monti, dei siti: strutture linguistiche preistoriche - Claudio Beretta - Google Libros". Books.google.es. Retrieved 2016-05-14.
- Lopez Guerra, JL; Rivin, E; Guedea, F; Ortiz, MJ (2015-09-28). "Radiation oncology in Latin speaking countries: A link between Europe and Latin America". Rep Pract Oncol Radiother. 19: 227–9. doi:10.1016/j.rpor.2013.06.004. PMC 4104016. PMID 25061515.
- "The World Factbook". Cia.gov. Retrieved 2016-05-14.
- "The World Factbook". Cia.gov. Retrieved 2016-05-14.
- "The World Factbook". Cia.gov. 2015-10-31. Retrieved 2016-05-14.
Geographical distribution of languages | |
|---|---|
| Romanic-speaking world | |
| Germanic-speaking world | |
| Slavic-speaking world | |
| Other | |
| |
This article is issued from Wikipedia. The text is licensed under Creative Commons - Attribution - Sharealike. Additional terms may apply for the media files.