Opinion polling for the 2023 Turkish general election
In the run up to the Turkish general election scheduled to take place in 2023, various organisations carry out opinion polling to gauge voting intention in Turkey. Results of such polls are displayed in this article. These polls only include Turkish voters nationwide and do not take into account Turkish expatriates voting abroad. The date range for these opinion polls are from the previous general election, held on 24 June 2018, to the present day.
Presidential election
First round
| Date | Polling firm | AKP | CHP | HDP | İYİ | MHP | DEVA | GP | Others | Lead | ||||||
|---|---|---|---|---|---|---|---|---|---|---|---|---|---|---|---|---|
| Generic | Erdoğan | Generic | İnce | İmamoğlu | Yavaş | Generic | Demirtaş | Generic | Akşener | Bahçeli | Babacan | Davutoğlu | ||||
| May 2020 | Konsensus | - | 40.9 | - | - | 26.3 | - | - | 8.8 | - | 9.5 | - | - | - | 14.5 | 32.2 |
| Apr 2020 | Artibir | - | 40.1 | - | - | 33.2 | - | - | 8.1 | - | 6.8 | 4.2 | 2.9 | 2.5 | 2.2 | 6.9 |
| Mar 2020 | ADA | - | 44.3 | - | 1.4 | 25.5 | 2.9 | - | 6.6 | - | 6.2 | 4.9 | 3.2 | 1.3 | 3.7 | 18.8 |
| Feb 2020 | Polimetre | 38.5 | - | 35.1 | - | - | - | 9.3 | - | 8.1 | - | - | - | - | 9.0 | 3.4 |
| Jan 2020 | Artibir | - | 45.4 | - | - | 34.6 | - | - | 8.6 | - | - | - | - | - | 3.1 | 10.8 |
| Sep 2019 | Polimetre | 46.2 | - | 34.7 | - | - | - | 9.5 | - | 8.4 | - | - | - | - | 1.2 | 11.5 |
| Sep 2019 | ADA | - | 39.1 | - | 2.0 | 28.6 | - | - | 8.0 | - | 6.8 | 6.5 | - | 2.3 | 6.7 | 10.5 |
| Aug 2018 | SAROS | - | 45.0 | - | 4.9 | 19.2 | - | - | 15.3 | - | 12.8 | - | - | - | 2.8 | 25.8 |
| Jul 2018 | ORC | - | 56.7 | - | 27.7 | - | - | - | 8.4 | - | 6.5 | - | - | - | 0.7 | 29.0 |
| 24 Jun 2018 | Presidential election | 52.6 | 30.6 | 8.4 | 7.3 | - | - | - | 1.1 | 20.0 | ||||||
Second round
| Date | Polling firm | AKP | CHP | Independent | Undecided | Lead | |
|---|---|---|---|---|---|---|---|
| Erdoğan | İmamoğlu | Yavaş | Gül | ||||
| May 2020 | AKAM | 42.4 | 49.5 | - | - | 8.1 | 7.1 |
| May 2020 | 39.9 | - | 39.7 | - | 20.4 | 0.2 | |
| May 2020 | Optimar | 46.7 | - | - | 30.4 | 22.9 | 16.3 |
| May 2020 | 44.7 | 43.7 | - | - | 21.6 | 1.0 | |
| May 2020 | 43.0 | - | 36.1 | - | 20.9 | 6.9 | |
| Apr 2020 | Artibir | 44.3 | 55.7 | - | - | - | 11.4 |
| Nov 2019 | PIAR | 39.7 | 44.5 | - | - | 15.8 | 4.8 |
Parliamentary election
Poll results are listed in the tables below in reverse chronological order, showing the most recent first, and using the date the survey's fieldwork was done, as opposed to the date of publication. If such date is unknown, the date of publication is given instead. The highest percentage figure in each polling survey is displayed in bold, and the background shaded in the leading party's color. In the instance that there is a tie, then no figure is shaded. The lead column on the right shows the percentage-point difference between the two parties with the highest figures. When a specific poll does not show a data figure for a party, the party's cell corresponding to that poll is shown empty.
Graphical summary
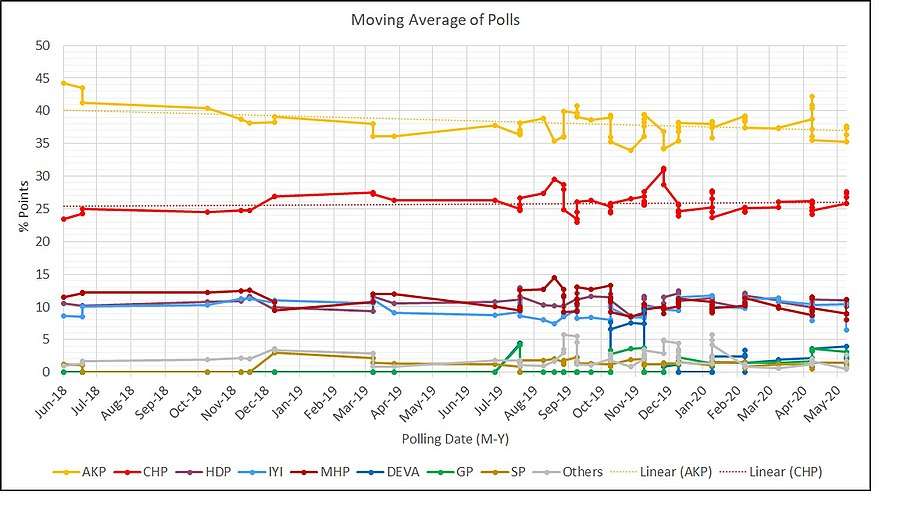
Party vote
| Date | Polling firm | AKP | CHP | HDP | İYİ | MHP | DEVA | GP | SP | Others | Lead |
|---|---|---|---|---|---|---|---|---|---|---|---|
| Jun 2020 | Sosyo Politik | 35.1 | 24.1 | 11.8 | 8.2 | 9.0 | 6.0 | 4.2 | 1.6 | 0.0 | 11.0 |
| Jun 2020 | MAK | 35.5 | 25.3 | 9.3 | 11.0 | 8.8 | 2.8 | 2.9 | 1.2 | 1.2 | 10.2 |
| Jun 2020 | AKAM | 35.1 | 28.0 | 12.0 | 12.1 | 7.1 | 3.0 | 2.4 | - | 0.3 | 7.1 |
| Jun 2020 | MetroPoll | 38.5 | 27.1 | 10.5 | 9.6 | 9.1 | 1.6 | 1.6 | 0.9 | 0.8 | 11.3 |
| May 2020 | AREA | 39.0 | 24.5 | 10.0 | 12.0 | 8.0 | 2.6 | 1.4 | 1.9 | 0.6 | 14.5 |
| May 2020 | AKAM | 34.5 | 30.6 | 10.4 | 10.2 | 8.2 | 3.0 | 2.3 | 0.5 | 0.3 | 4.8 |
| May 2020 | Optimar | 42.8 | 23.4 | 9.5 | 9.1 | 10.2 | 1.3 | 1.1 | - | 2.7 | 19.4 |
| May 2020 | GENAR | 45.4 | 23.5 | 10.3 | 8.3 | 9.8 | 0.6 | 0.5 | - | 1.6 | 21.9 |
| May 2020 | ORC | 38.4 | 25.6 | 10.3 | 6.4 | 14.1 | 1.0 | 1.9 | 1.1 | 1.2 | 12.8 |
| May 2020 | MAK | 37.4 | 25.3 | 9.4 | 10.9 | 10.7 | 1.7 | 2.4 | 1.1 | 1.1 | 12.1 |
| May 2020 | AREA | 35.8 | 24.8 | 12.1 | 11.8 | 9.6 | 2.0 | - | - | 3.9 | 11.0 |
| Apr 2020 | AKAM | 34.0 | 28.4 | 11.1 | 11.7 | 9.0 | 2.7 | 2.5 | 0.5 | 0.3 | 5.6 |
| Apr 2020 | 38.7 | 22.8 | 12.0 | 10.5 | 13.2 | 0.3 | 0.5 | 1.2 | 0.8 | 15.9 | |
| Mar 2020 | 44.0 | 23.1 | 9.8 | 8.6 | 9.3 | 1.4 | 1.2 | 1.7 | 1.0 | 20.9 | |
| Mar 2020 | ADA | 38.3 | 22.6 | 9.7 | 10.5 | 11.2 | 3.4 | 2.0 | 1.3 | 1.0 | 15.7 |
| Mar 2020 | Artıbir | 35.4 | 30.1 | 10.1 | 10.5 | 10.0 | - | 1.3 | 1.6 | 1.0 | 5.3 |
| Mar 2020 | İEA | 41.6 | 21.2 | 12.9 | 11.7 | 10.0 | - | 0.7 | 0.7 | 1.2 | 20.4 |
| Mar 2020 | KONDA | 39.4 | 24.0 | 12.2 | 11.1 | 11.8 | - | - | - | 1.4 | 15.4 |
| Feb 2020 | 38.4 | 22.3 | 12.4 | 13.8 | 11.2 | - | - | - | 1.9 | 16.1 | |
| Feb 2020 | AREA | 38.1 | 24.4 | 11.6 | 10.7 | 11.1 | - | - | - | - | 13.7 |
| Feb 2020 | Artıbir | 37.4 | 28.9 | 10.1 | 10.5 | 9.9 | - | 1.3 | 1.1 | 0.8 | 8.5 |
| Feb 2020 | Themis | 38.0 | 29.3 | 8.0 | 7.3 | 10.0 | - | 0.7 | 3.3 | 3.3 | 8.7 |
| Feb 2020 | IEA | 39.7 | 25.1 | 10.5 | 10.8 | 9.2 | - | 1.1 | 0.3 | 3.3 | 14.5 |
| Feb 2020 | Polimetre | 30.0 | 25.3 | 12.8 | 11.1 | 8.9 | - | - | 1.5 | 10.5 | 4.7 |
| Jan 2020 | 30.2 | 25.4 | 12.6 | 11.1 | 8.9 | - | - | 1.5 | 10.5 | 4.8 | |
| Jan 2020 | MetroPoll | 40.0 | 25.5 | 12.1 | 8.3 | 10.1 | 0.8 | 1.2 | 1.2 | 0.8 | 14.5 |
| Jan 2020 | CHP | 35.9 | 26.3 | 11.4 | 9.1 | 11.0 | 1.6 | 1.2 | 1.4 | 2.0 | 9.6 |
| Jan 2020 | AREA | 36.2 | 24.8 | 12.9 | 11.1 | 11.3 | - | - | - | 3.8 | 10.4 |
| Jan 2020 | IEA | 38.5 | 22.1 | 13.0 | 10.0 | 9.3 | - | 1.1 | 1.3 | 4.7 | 16.4 |
| 2-7 Jan 2020 | Artıbir | 38.0 | 27.3 | 8.5 | 10.1 | 11.3 | - | 2.3 | 1.6 | 0.9 | 10.7 |
| 28-31 Dec 2019 | ORC | 36.1 | 27.1 | 9.3 | 4.9 | 16.3 | - | 2.2 | 0.9 | 3.3 | 9.0 |
| Dec 2019 | KOMSAR | 36.1 | 26.8 | 11.8 | 8.8 | 7.2 | 5.5 | 2.2 | 0.8 | 0.7 | 9.3 |
| Dec 2019 | Blockchain | 33.8 | 28.0 | 3.9 | 5.8 | 9.4 | 9.4 | 5.3 | 3.3 | 1.1 | 5.8 |
| Dec 2019 | AREA | 38.3 | 25.8 | 10.5 | 10.6 | 10.6 | - | - | - | 4.2 | 12.5 |
| Dec 2019 | MetroPoll | 41.0 | 24.8 | 11.0 | 8.3 | 9.8 | - | 2.0 | 0.8 | 2.3 | 16.2 |
| 12-22 Dec 2019 | MAK | 38.0 | 24.9 | 9.9 | 11.7 | 11.9 | - | - | 1.2 | 4.4 | 13.1 |
| 25 Nov-13 Dec 2019 | Kadir Has University | 40.2 | 33.0 | 9.2 | 8.3 | 8.1 | - | - | - | 1.2 | 6.8 |
| Mar-Dec 2019 | CHP | 32.4 | 35.1 | 9.9 | 9.4 | 10.0 | - | - | - | 3.2 | 2.7 |
| Dec 2019 | AR-G | 36.8 | 26.9 | 12.1 | 9.4 | 10.9 | - | - | 1.4 | 1.3 | 9.9 |
| Dec 2019 | IEA | 40.1 | 24.9 | 11.6 | 10.0 | 8.6 | - | - | - | 4.6 | 15.2 |
| Nov 19-24 | PIAR | 31.9 | 24.7 | 10.2 | 10.6 | 9.0 | 7.7 | 3.4 | 1.7 | 0.8 | 7.2 |
| 09–12 Nov 2019 | ORC | 36.6 | 28.9 | 9.5 | 3.9 | 17.2 | - | - | 1.5 | 2.3 | 7.7 |
| Nov 2019 | Metropoll | 42.0 | 24.0 | 12.2 | 9.6 | 11.0 | - | - | 0.9 | 0.3 | 18.0 |
| Nov 2019 | AREA | 38.3 | 23.3 | 12.6 | 10.5 | 11.8 | - | - | - | 3.5 | 15.0 |
| Nov 2019 | IEA | 37.8 | 25.8 | 11.0 | 10.1 | 11.4 | - | - | - | 3.9 | 12.0 |
| Oct 29-Nov 1 | Sosyo Politik | 38.3 | 27.7 | 10.3 | 4.8 | 7.8 | 2.4 | 3.9 | 0.9 | 3.9 | 10.6 |
| Oct 2019 | IEA | 40.2 | 24.8 | 13.7 | 10.3 | 8.2 | - | - | - | 3.3 | 15.4 |
| 21–29 Oct 2019 | ADA | 41.9 | 21.3 | 7.5 | 7.5 | 8.4 | - | 2.3 | 9.2 | 20.6 | |
| 14 Oct 2019 | Polimetre | 37.3 | 25.9 | 13.1 | 11.5 | 9.9 | - | - | 1.5 | 0.8 | 11.4 |
| Oct 2019 | AREA | 37.0 | 24.1 | 12.4 | 10.8 | 11.4 | - | - | - | 4.2 | 12.9 |
| Oct 2019 | Metropoll | 43.2 | 23.4 | 10.7 | 9.3 | 11.9 | - | - | 1.1 | 0.4 | 19.8 |
| 11 Sep 2019 | ORC | 35.7 | 30.9 | 9.4 | 4.5 | 16.6 | - | - | 2.0 | 0.8 | 4.1 |
| 5–10 Sep 2019 | Optimar | 40.5 | 26.7 | 9.3 | 9.0 | 10.9 | - | - | 2.0 | 1.7 | 13.8 |
| 1–7 Sep 2019 | AKAM | 29.9 | 30.8 | 11.7 | 8.9 | 16.0 | - | - | - | 2.7 | 0.9 |
| 1–2 Sep 2019 | AR-G | 37.8 | 28.4 | 9.2 | 7.7 | 11.1 | - | - | 1.2 | 4.6 | 9.4 |
| Sep 2019 | Metropoll | 40.2 | 24.5 | 12.0 | 10.5 | 10.7 | - | - | 1.6 | 0.4 | 16.2 |
| 19–30 Aug 2019 | ADA | 37.5 | 22.8 | 9.0 | 7.0 | 9.5 | - | - | 0.9 | 1.8 | 14.7 |
| 11 Aug 2019 | N/S | 39.0 | 27.0 | 11.0 | 10.1 | 9.9 | - | - | - | 3.0 | 12.0 |
| 2–7 Aug 2019 | SAROS | 32.5 | 25.2 | 13.4 | 10.5 | 9.1 | 4.4 | 4.2 | - | 0.7 | 7.3 |
| 38.6 | 24.7 | 13.5 | 10.8 | 10.5 | N/A | - | 1.9 | 13.9 | |||
| 6–11 Jul 2019 | PİAR | 36.7 | 29.1 | 12.2 | 9.1 | 10.8 | 1.6 | 0.5 | 7.6 | ||
| 9–17 Apr 2019 | AKAM | 34.0 | 27.0 | 10.4 | 11.1 | 15.6 | 1.4 | 0.4 | 7.0 | ||
| 31 Mar 2019 | Local elections | 42.5 | 29.6 | 5.6 | 7.4 | 7.2 | 3.0 | 6.6 | 16.9 | ||
| 9–19 Mar 2019 | AREA | 37.5 | 25.8 | 12.1 | 13.2 | 9.6 | - | 1.7 | 12.3 | ||
| 13–19 Jan 2019 | Piar | 35.0 | 25.9 | 11.0 | 12.1 | 13.6 | - | 2.4 | 9.1 | ||
| Jan 2019 | AREA | 37.1 | 25.2 | 12.2 | 12.3 | 11.6 | - | 1.7 | 11.9 | ||
| 9 Dec 2018 | CHP | 42.2 | 23.3 | - | 9.3 | 12.4 | - | - | 18.9 | ||
| Dec 2018 | AREA | 38.8 | 25.0 | 10.8 | 12.2 | 11.2 | - | 2.0 | 12.2 | ||
| Nov 2018 | AREA | 40.2 | 25.1 | 10.7 | 9.5 | 13.0 | - | 1.9 | 15.1 | ||
| 14–19 Jul 2018 | MAK | 45.5 | 22.9 | 10.9 | 7.6 | 10.9 | 1.1 | 1.1 | 22.6 | ||
| 11 Jul 2018 | ORC | 44.7 | 24.7 | 8.9 | 8.3 | 12.3 | - | 1.1 | 20.0 | ||
| 24 Jun 2018 | Parliamentary election | 42.6 | 22.6 | 11.7 | 10.0 | 11.1 | N/A | N/A | 1.3 | 0.7 | 20.0 |