North West Dumfries (ward)
North West Dumfries is one of the thirteen wards used to elect members of the Dumfries and Galloway Council. It elects four Councillors.
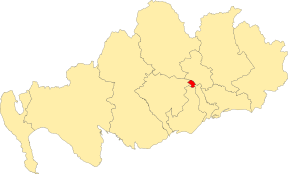
Location of the ward [1]
Councillors
| Election | Councillors | |||||||
|---|---|---|---|---|---|---|---|---|
| 2007 | Ronnie Nicholson (Labour) |
David John McKie (Labour) |
John Graham Bell (Conservative) |
Doug Snell (SNP) | ||||
| 2012 | Andy Ferguson (SNP) | |||||||
| 2017 | ||||||||
Election Results
2017 Election
2017 Dumfries and Galloway Council election [2]
| North West Dumfries - 4 seats | |||||||||
|---|---|---|---|---|---|---|---|---|---|
| Party | Candidate | FPv% | Count 1 | Count 2 | Count 3 | Count 4 | Count 5 | ||
| Conservative | John Graham Bell (incumbent) | 32.54 | 1,374 | ||||||
| SNP | Andy Ferguson (incumbent) | 16.41 | 693 | 708.02 | 736.4 | 774.41 | 1,314.26 | ||
| Labour | Ronnie Nicholson (incumbent)†† | 16.08 | 679 | 722.51 | 732.59 | 763.44 | 778.6 | ||
| Labour | David John McKie (incumbent) | 14.47 | 611 | 694.93 | 720.86 | 784.57 | 809.27 | ||
| SNP | Stacy Bradley | 13.60 | 574 | 588.25 | 613.02 | 642.33 | |||
| Independent | Billy Farries | 3.86 | 163 | 268.88 | 304.73 | ||||
| Scottish Green | Michelle Johnston | 3.03 | 128 | 156.49 | |||||
| Electorate: 9,981 Valid: 4,222 Spoilt: 112 Quota: 845 Turnout: 42.3 | |||||||||
2012 Election
2012 Dumfries and Galloway Council election [3]
| North West Dumfries - 4 seats | |||||||||
|---|---|---|---|---|---|---|---|---|---|
| Party | Candidate | FPv% | Count 1 | Count 2 | Count 3 | Count 4 | Count 5 | ||
| Labour | Ronnie Nicholson (incumbent) | 23.25 | 932 | ||||||
| Conservative | John Graham Bell (incumbent)†† | 22.43 | 899 | ||||||
| Labour | David John McKie (incumbent) | 21.38 | 857 | ||||||
| SNP | Andy Ferguson | 18.44 | 739 | 746.1 | 768.5 | 773.2 | 982.1 | ||
| Labour | Paula Stevenson | 14.50 | 581 | 690.1 | 702.2 | 746.7 | |||
| Electorate: 9,906 Valid: 4,008 Spoilt: 66 Quota: 802 Turnout: 4,074 (40.46%) | |||||||||
2007 Election
2007 Dumfries and Galloway Council election [4]
| North West Dumfries | |||||||||||
|---|---|---|---|---|---|---|---|---|---|---|---|
| Party | Candidate | FPv% | Count 1 | Count 2 | Count 3 | Count 4 | Count 5 | Count 6 | Count 7 | ||
| Labour | Ronnie Nicholson | 25.6 | 1,327 | ||||||||
| Conservative | John Graham Bell | 20.4 | 1,060 | ||||||||
| Labour | David John McKie | 19.2 | 996 | 1,132.95 | |||||||
| SNP | Doug Snell | 15.6 | 809 | 819.85 | 824.49 | 827.34 | 864.91 | 950.22 | 1,179.06 | ||
| Labour | Stephen David Harman | 12.5 | 650 | 722.49 | 789.41 | 790.64 | 823.31 | 868.90 | |||
| Liberal Democrats | Joe Sweeney | 3.6 | 188 | 192.12 | 194.25 | 197.99 | 240.41 | ||||
| Independent | Arthur Tremble | 3.1 | 163 | 169.73 | 173.46 | 177.52 | |||||
| Electorate: 9,794 Valid: 5,193 Spoilt: 124 Quota: 1,039 Turnout: 54.3% | |||||||||||
References
This article is issued from Wikipedia. The text is licensed under Creative Commons - Attribution - Sharealike. Additional terms may apply for the media files.