Nicolosi globular projection
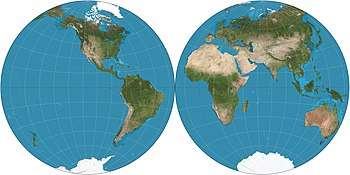
The Nicolosi globular projection is a map projection invented about the year 1,000 by the Iranian polymath al-Biruni. As a circular representation of a hemisphere, it is called globular because it evokes a globe. It can only display one hemisphere at a time and so normally appears as a "double hemispheric" presentation in world maps. The projection came into use in the Western world starting in 1660, reaching its most common use in the 19th century. As a "compromise" projection, it preserves no particular properties, instead giving a balance of distortions.

History
Abū Rayḥān Muḥammad ibn Aḥmad Al-Bīrūnī, who was the foremost Muslim scholar of the Islamic Golden Age, invented the first recorded globular projection for use in celestial maps about the year 1000.[1] Centuries later, as Europe entered its Age of Discovery, the demand for world maps increased rapidly, sparking a vast experimentation with diverse map projections. Globular projections were one category that received early attention, with inventions by Roger Bacon in the 13th century, Petrus Apianus in the 16th century, and also in the 16th century by French Jesuit priest Georges Fournier. In 1660, Giovanni Battista Nicolosi, a Sicilian chaplain in Rome, reinvented Al-Biruni's projection as a modification of Fournier's first projection. It is unlikely Nicolosi knew of al-Biruni's work, and Nicolosi's name is the one usually associated with the projection.[2]
Nicolosi published a set of maps on the projection, one of the world in two hemispheres, and one each for the five known continents. Maps using the same projection appeared occasionally over the ensuring centuries, becoming relatively common in the 19th century as the stereographic projection fell out of common use for this purpose. Use of the Nicolosi projection continued into the early 20th century. It is rarely seen today.
Description
Nicolosi developed the projection as a drafting technique. Translating that into mathematical formulae yields:[3]

Here, is the latitude, is the longitude, is the central longitude for the hemisphere, and is the radius of the globe to be projected.


In the formula for , the sign takes the sign of , i.e. take the positive root if is positive, or the negative root if is negative.


In the formula for , the sign takes the opposite sign of , i.e. take the positive root if is negative, or the negative root if is positive.

Under certain circumstances, the full formulae fail. Use the following formulae instead:
When ,


When ,


When ,


When ,

See also
References
- Keuning, Johannes (1955). "The history of geographical map projections until 1600". Imago Mundi. 12: 20.
- Snyder, John P. (1993). Flattening the Earth: Two Thousand Years of Map Projections. Chicago and London: The University of Chicago Press. p. 41. ISBN 0-226-76746-9.
- Snyder, John P (1989). An Album of Map Projections. Professional Paper 1453. Washington, D.C.: U.S. Geological Survey. p. 234.