National team appearances in the World Baseball Classic
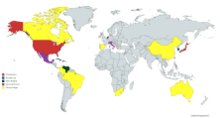
This article lists the performances of each of the 20 national teams which have made at least one appearance in the World Baseball Classic. The 2006 and 2009 tournaments, each had the same 16–team field, chosen by invitation. Beginning with the 2013 tournament, the four last-place teams from the previous tournament's first round each contested a qualifying round against three additional teams.
The three teams to have won the tournament are Japan (2006, 2009), the Dominican Republic (2013), and the United States (2017). Other teams to have reached the championship game are Cuba (2006), South Korea (2009), and Puerto Rico (2013, 2017). Other teams to have reached the semifinals are the Netherlands and Venezuela. Other teams to have reached the second round are Israel, Italy, Mexico, and Chinese Taipei. The United States is the current World Baseball Classic champion, defeating Puerto Rico at the 2017 World Baseball Classic Final.
Debut of teams
| Year | Debutants | Total | CT |
|---|---|---|---|
| 2006 | 16 | 16 | |
| 2009 | none | 0 | 16 |
| 2013 | 2 | 18 | |
| 2017 | 2 | 20 | |
| 2023 | TBA | – | 20 |
Number of appearances
| Team | Apps | Record streak |
Active streak |
Debut | Most recent |
Best result |
|---|---|---|---|---|---|---|
| 5 | 5 | 5 | 2006 | 2021 | Round 1 | |
| 5 | 5 | 5 | 2006 | 2021 | Round 1 | |
| 5 | 5 | 5 | 2006 | 2021 | Round 1 | |
| 5 | 5 | 5 | 2006 | 2021 | Round 2 (2013) | |
| 5 | 5 | 5 | 2006 | 2021 | Runners-up (2006) | |
| 5 | 5 | 5 | 2006 | 2021 | Champions (2013) | |
| 5 | 5 | 5 | 2006 | 2021 | Round 2 (2013) | |
| 5 | 5 | 5 | 2006 | 2021 | Champions (2006, 2009) | |
| 5 | 5 | 5 | 2006 | 2021 | Round 2 (2006, 2009) | |
| 5 | 5 | 5 | 2006 | 2021 | Fourth place (2013, 2017) | |
| 5 | 5 | 5 | 2006 | 2021 | Runners-up (2013, 2017) | |
| 5 | 5 | 5 | 2006 | 2021 | Runners-up (2009) | |
| 5 | 5 | 5 | 2006 | 2021 | Champions (2017) | |
| 5 | 5 | 5 | 2006 | 2021 | Third place (2009) | |
| 2 | 2 | 0 | 2006 | 2009 | Round 1 | |
| 2 | 2 | 0 | 2006 | 2009 | Round 1 | |
| 2 | 2 | 2 | 2017 | 2021 | Round 1 | |
| 2 | 2 | 2 | 2017 | 2021 | Round 2 (2017) | |
| 1 | 1 | 0 | 2013 | 2013 | Round 1 | |
| 1 | 1 | 0 | 2013 | 2013 | Round 1 | |
Comprehensive team results by tournament
- Legend
- 1st – Champions
- 2nd – Runners-up
- 3rd – Third place
- 4th – Fourth place
- R2 – Round 2 (2006–2017: second round, 2021–present: quarterfinals)
- R1 – Round 1
- • – Did not qualify
- × – Did not enter
- q – Qualified for forthcoming tournament
| Team | 2006 (16) |
2009 (16) |
2013 (16) |
2017 (16) |
2023 (20) |
Total |
|---|---|---|---|---|---|---|
| R1 13th | R1 12th | R1 16th | R1 9th | 4 | ||
| × | × | R1 14th | • | 1 | ||
| R1 9th | R1 13th | R1 12th | R1 15th | 4 | ||
| R1 15th | R1 11th | R1 13th | R1 16th | 4 | ||
| R1 12th | R1 14th | R2 8th | R1 14th | 4 | ||
| × | × | • | R1 11th | 1 | ||
| 2nd | R2 6th | R2 5th | R2 7th | 4 | ||
| 4th | R1 9th | 1st | R2 5th | 4 | ||
| × | × | • | R2 6th | 1 | ||
| R1 10th | R1 10th | R2 7th | R1 12th | 4 | ||
| 1st | 1st | 3rd | 3rd | 4 | ||
| R2 6th | R2 8th | R1 11th | R1 13th | 4 | ||
| R1 11th | R2 7th | 4th | 4th | 4 | ||
| R1 14th | R1 15th | • | • | 2 | ||
| R2 5th | R2 5th | 2nd | 2nd | 4 | ||
| R1 16th | R1 16th | • | • | 2 | ||
| 3rd | 2nd | R1 9th | R1 10th | 4 | ||
| × | × | R1 15th | • | 1 | ||
| R2 8th | 4th | R2 6th | 1st | 4 | ||
| R2 7th | 3rd | R1 10th | R2 8th | 4 | ||
| Team | 2006 (16) |
2009 (16) |
2013 (16) |
2017 (16) |
2023 (20) |
Total |
Overall team records
The table is accurate as of the end of the 2017 World Baseball Classic. Teams in bold are part of the 2021 World Baseball Classic.
| Team | Part | Pld | W | L | PCT |
|---|---|---|---|---|---|
| 4 | 24 | 18 | 6 | .750 | |
| 4 | 31 | 23 | 8 | .742 | |
| 4 | 29 | 20 | 9 | .690 | |
| 4 | 22 | 15 | 7 | .682 | |
| 1 | 6 | 4 | 2 | .667 | |
| 4 | 26 | 15 | 11 | .577 | |
| 4 | 28 | 16 | 12 | .571 | |
| 4 | 24 | 12 | 12 | .500 | |
| 4 | 24 | 11 | 13 | .458 | |
| 4 | 18 | 7 | 11 | .389 | |
| 4 | 15 | 5 | 10 | .333 | |
| 1 | 3 | 1 | 2 | .333 | |
| 4 | 11 | 3 | 8 | .273 | |
| 4 | 13 | 3 | 10 | .231 | |
| 4 | 12 | 2 | 10 | .167 | |
| 4 | 12 | 2 | 10 | .167 | |
| 1 | 3 | 0 | 3 | .000 | |
| 1 | 3 | 0 | 3 | .000 | |
| 2 | 5 | 0 | 5 | .000 | |
| 2 | 5 | 0 | 5 | .000 |
Performance of host nations
Since the WBC's format allows multiple nations to host different rounds of the event, seven different nations have hosted at least one round through the first four iterations of the tournament. Records of each nation when playing on its home soil are listed below.
| Team | Pld | W | L | PCT |
|---|---|---|---|---|
| 18 | 15 | 3 | .833 | |
| 12 | 9 | 3 | .750 | |
| 3 | 2 | 1 | .667 | |
| 25 | 14 | 11 | .560 | |
| 7 | 3 | 4 | .429 | |
| 3 | 1 | 2 | .333 | |
| 2 | 0 | 2 | .000 | |
The following table lists the teams who've earned the most wins against host countries.
| Rk | Team | Wins |
|---|---|---|
| 1 | 4 | |
| 4 | ||
| 3 | 3 | |
| 3 | ||
| 5 | 2 | |
| 2 | ||
| 2 |
Results of defending champions and runners-up
| Year | Defending champions | Finish | Defending runners-up | Finish |
|---|---|---|---|---|
| 2009 | Champions | Second Round | ||
| 2013 | Third place | First round | ||
| 2017 | Second round | Runners-up | ||
| 2023 | TBD | TBD |
Medal table
| Rank | Nation | Gold | Silver | Bronze | Total |
|---|---|---|---|---|---|
| 1 | 2 | 0 | 2 | 4 | |
| 2 | 1 | 0 | 0 | 1 | |
| 1 | 0 | 0 | 1 | ||
| 4 | 0 | 2 | 0 | 2 | |
| 5 | 0 | 1 | 1 | 2 | |
| 6 | 0 | 1 | 0 | 1 | |
| 7 | 0 | 0 | 1 | 1 | |
| Totals (7 nations) | 4 | 4 | 4 | 12 | |
External links
International baseball | ||
|---|---|---|
| WBSC Events |  | |
| Minor World Events | ||
| Defunct World Events | ||
| Africa | ||
| Americas | ||
| Asia |
| |
| Europe | ||
| Oceania |
| |