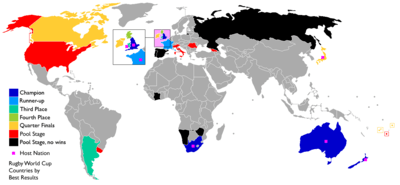
National team appearances in the Rugby World Cup
This article presents the national team appearances in the Rugby World Cup. The article tracks the appearances, results, and debuts for all national teams that have participated in at least one Rugby World Cup.
Number of appearances
Tournament appearances by team, up to and including 2019:
| Team | Apps | Record streak |
Active streak |
Debut | Most recent |
Best result |
|---|---|---|---|---|---|---|
| 9 | 9 | 9 | 1987 | 2019 | Champions (1987, 2011, 2015) | |
| 7 | 7 | 7 | 1995 | 2019 | Champions (1995, 2007, 2019) | |
| 9 | 9 | 9 | 1987 | 2019 | Champions (1991, 1999) | |
| 9 | 9 | 9 | 1987 | 2019 | Champions (2003) | |
| 9 | 9 | 9 | 1987 | 2019 | Runners-up (1987, 1999, 2011) | |
| 9 | 9 | 9 | 1987 | 2019 | Third place (1987) | |
| 9 | 9 | 9 | 1987 | 2019 | Third place (2007) | |
| 9 | 9 | 9 | 1987 | 2019 | Fourth place (1991) | |
| 9 | 9 | 9 | 1987 | 2019 | Quarter-finals (seven times) | |
| 8 | 6 | 6 | 1987 | 2019 | Quarter-finals (1987, 2007) | |
| 8 | 8 | 8 | 1991 | 2019 | Quarter-finals (1991, 1995) | |
| 9 | 9 | 9 | 1987 | 2019 | Quarter-finals (1991) | |
| 9 | 9 | 9 | 1987 | 2019 | Quarter-finals (2019) | |
| 9 | 9 | 9 | 1987 | 2019 | 2 wins (five times) | |
| 8 | 7 | 7 | 1987 | 2019 | 2 wins (2007, 2011) | |
| 5 | 5 | 5 | 2003 | 2019 | 2 wins (2015) | |
| 8 | 8 | 0 | 1987 | 2015 | 1 win (six times) | |
| 8 | 6 | 6 | 1987 | 2019 | 1 win (1987, 2003, 2011) | |
| 4 | 2 | 2 | 1999 | 2019 | 1 win (1999, 2003, 2019) | |
| 2 | 2 | 0 | 1987 | 1991 | 0 wins | |
| 1 | 1 | 0 | 1995 | 1995 | 0 wins | |
| 6 | 6 | 6 | 1999 | 2019 | 0 wins | |
| 1 | 1 | 0 | 1999 | 1999 | 0 wins | |
| 1 | 1 | 0 | 2007 | 2007 | 0 wins | |
| 2 | 1 | 1 | 2011 | 2019 | 0 wins | |
Results by tournament
- Legend
- QF — Quarterfinalist
- R2 — Round 2 (1999: quarterfinal playoffs)
- R1 — Round 1 (pool stage)
- Q — Qualified
- •• — Invited but declined or qualified but withdrew
- • — Did not qualify
- — Not invited (1987) / Did not enter or withdrew from qualifying
- — Hosts
For each tournament, the number of teams in each finals tournament (in brackets) are shown.
| Team | 1987 (16) |
1991 (16) |
1995 (16) |
1999 (20) |
2003 (20) |
2007 (20) |
2011 (20) |
2015 (20) |
2019 (20) |
2023 (20) |
|---|---|---|---|---|---|---|---|---|---|---|
| Africa | ||||||||||
| • | R1 | • | • | • | • | • | • | TBD | ||
| • | R1 | R1 | R1 | R1 | R1 | R1 | TBD | |||
| 1st | 3rd | QF | 1st | QF | 3rd | 1st | Q | |||
| R1 | R1 | • | • | • | • | • | • | • | TBD | |
| Asia | ||||||||||
| R1 | R1 | R1 | R1 | R1 | R1 | R1 | R1 | QF | Q | |
| Europe | ||||||||||
| QF | 2nd | 4th | QF | 1st | 2nd | QF | R1 | 2nd | Q | |
| 2nd | QF | 3rd | 2nd | 4th | 4th | 2nd | QF | QF | Q | |
| ••(1) | • | • | R1 | R1 | R1 | R1 | R1 | TBD | ||
| QF | QF | QF | R2 | QF | R1 | QF | QF | QF | Q | |
| R1 | R1 | R1 | R1 | R1 | R1 | R1 | R1 | R1 | Q | |
| • | • | • | • | R1 | • | • | • | TBD | ||
| R1 | R1 | R1 | R1 | R1 | R1 | R1 | R1 | •(4) | TBD | |
| ••(1) | • | • | • | • | R1 | • | R1 | TBD | ||
| QF | 4th | QF | QF | QF | QF | R1 | QF | R1 | Q | |
| • | • | R1 | • | • | • | • | •(4) | TBD | ||
| 3rd | R1 | R1 | QF | QF | R1 | 4th | QF | 4th | Q | |
| North America | ||||||||||
| R1 | QF | R1 | R1 | R1 | R1 | R1 | R1 | R1 | TBD | |
| R1 | R1 | • | R1 | R1 | R1 | R1 | R1 | R1 | TBD | |
| Oceania | ||||||||||
| 4th | 1st | QF | 1st | 2nd | QF | 3rd | 2nd | QF | Q | |
| QF | R1 | • | R2 | R1 | QF | R1 | R1 | R1 | Q | |
| 1st | 3rd | 2nd | 4th | 3rd | QF | 1st | 1st | 3rd | Q | |
| QF | QF | R2 | R1 | R1 | R1 | R1 | R1 | TBD | ||
| R1 | • | R1 | R1 | R1 | R1 | R1 | R1 | R1 | TBD | |
| South America | ||||||||||
| R1 | R1 | R1 | QF | R1 | 3rd | QF | 4th | R1 | Q | |
| • | R1 | R1 | • | • | R1 | R1 | TBD | |||
| Team | 1987 (16) |
1991 (16) |
1995 (16) |
1999 (20) |
2003 (20) |
2007 (20) |
2011 (20) |
2015 (20) |
2019 (20) |
2023 (20) |
- 1 Georgia and Russia were part of the Soviet Union in 1987, whose national team declined an invitation to the inaugural World Cup on political grounds.
- 2 Samoa was known as Western Samoa until 1997.
- 3 South Africa did not compete in 1987 and 1991 while subject to an international sporting boycott in opposition to the country's apartheid regime.
- 4 Romania and Spain fielded ineligible players during the Rugby Europe Championship, incurring points deductions resulting in their non-qualification in 2019.[1]
Debut of national teams
25 nations have thus far qualified for the Rugby World Cup. From 1987 until 2011, each edition featured at least one new debuting country. The 2015 tournament was the first edition with no country making its debut. It simply featured the return of Uruguay after not qualifying for the 2007 and 2011 editions. The 2019 was the same, with Romania disqualified and replaced by Russia.
| Year | Nation(s) | Total |
|---|---|---|
| 1987 | 16 | |
| 1991 | 1 | |
| 1995 | 2 | |
| 1999 | 3 | |
| 2003 | 1 | |
| 2007 | 1 | |
| 2011 | 1 | |
| 2015 | (none) | 0 |
| 2019 | (none) | 0 |
Result of host nations
The best result by hosts is champions, achieved by New Zealand in 1987 and 2011, and by South Africa in 1995. The worst result was by Wales in 1991 with only one win in pool play, although they did not host the final. The worst result by a country who hosted the final is held by England, being eliminated in the group stage in 2015.
| Year | Host nation | Finish |
|---|---|---|
| 1987 | Champions | |
| Fourth place | ||
| 1991 | Runners-up | |
| Fourth place | ||
| Quarter-finals | ||
| Quarter-finals | ||
| Group stage | ||
| 1995 | Champions | |
| 1999 | Quarter-finals | |
| 2003 | Runners-up | |
| 2007 | Fourth place | |
| 2011 | Champions | |
| 2015 | Group stage | |
| 2019 | Quarter-finals | |
| 2023 |
Results of defending champions
New Zealand is the only nation to successfully defend the World Cup as defending champions in 2015. Australia and England achieved runner up in 2003 and 2007, respectively. The worst results were by Australia in 1995 and South Africa in 2011, both exiting in the quarter-finals.
| Year | Defending champions | Finish |
|---|---|---|
| 1991 | Third place | |
| 1995 | Quarter-finals | |
| 1999 | Third place | |
| 2003 | Runners-up | |
| 2007 | Runners-up | |
| 2011 | Quarter-finals | |
| 2015 | Champions | |
| 2019 | Third place |
Performance by confederation
This is a summary of the best performances of each confederation in each tournament.
| Confederation | 1987 (16) |
1991 (16) |
1995 (16) |
1999 (20) |
2003 (20) |
2007 (20) |
2011 (20) |
2015 (20) |
2019 (20) |
2023 (20) |
|---|---|---|---|---|---|---|---|---|---|---|
| Africa | R1 | R1 | 1st | 3rd | QF | 1st | QF | 3rd | 1st | TBD |
| Asia | R1 | R1 | R1 | R1 | R1 | R1 | R1 | R1 | QF | TBD |
| Europe | 2nd | 2nd | 3rd | 2nd | 1st | 2nd | 2nd | QF | 2nd | TBD |
| North America | R1 | QF | R1 | R1 | R1 | R1 | R1 | R1 | R1 | TBD |
| Oceania | 1st | 1st | 2nd | 1st | 2nd | QF | 1st | 1st | 3rd | TBD |
| South America | R1 | R1 | R1 | QF | R1 | 3rd | QF | 4th | R1 | TBD |
Number of teams by confederation
This is a summary of the total number of participating teams by confederation in each tournament.
| Confederation | 1987 (16) |
1991 (16) |
1995 (16) |
1999 (20) |
2003 (20) |
2007 (20) |
2011 (20) |
2015 (20) |
2019 (20) |
2023 (20) |
|---|---|---|---|---|---|---|---|---|---|---|
| Africa | 1 | 1 | 2 | 2 | 2 | 2 | 2 | 2 | 2 | TBD |
| Asia | 1 | 1 | 1 | 1 | 1 | 1 | 1 | 1 | 1 | TBD |
| Europe | 7 | 7 | 7 | 8 | 8 | 9 | 9 | 8 | 8 | TBD |
| North America | 2 | 2 | 1 | 2 | 2 | 2 | 2 | 2 | 2 | TBD |
| Oceania | 4 | 4 | 4 | 5 | 5 | 5 | 5 | 5 | 5 | TBD |
| South America | 1 | 1 | 1 | 2 | 2 | 1 | 1 | 2 | 2 | TBD |
Appearance droughts
This section is a list of droughts associated with the participation of national rugby union teams in the Rugby World Cups.
Longest active droughts
Does not include teams that have not yet made their first appearance or teams that no longer exist.
| Team | Last appearance | WC Missed |
|---|---|---|
| 1991 | 7 | |
| 1995 | 6 | |
| 1999 | 5 | |
| 2007 | 3 | |
| 2015 | 1 |
Longest droughts overall
Only includes droughts begun after a team's first appearance and until the team ceased to exist updated to include qualification for the 2019 Rugby World Cup.
| Team | Prev. appearance | Next appearance | WC Missed |
|---|---|---|---|
| 1991 | active | 7 | |
| 1995 | active | 6 | |
| 1999 | active | 5 | |
| 2007 | active | 3 | |
| 2003 | 2015 | 2 | |
See also
- History of the Rugby World Cup
- Rugby World Cup qualification
- Rugby World Cup Overall Record
References
- "Russia handed World Cup place as Romania penalised for ineligible player". The Guardian. 16 May 2018.