List of Nashville Sounds team records
The Nashville Sounds Minor League Baseball team has played in Nashville, Tennessee, since its establishment in 1978. The team began as an expansion franchise of the Double-A Southern League.[1] They moved to the Triple-A American Association in 1985 and to the Triple-A Pacific Coast League in 1998.[1] As of the completion of the 2019 season, the club has played 6,004 regular season games and compiled a win–loss record of 3,083–2,921 (.513).[2] In the 14 seasons in which they have qualified for the playoffs, they have a postseason record of 42–41 (.506).[3] Combining all 6,087 regular season and postseason games, Nashville has an all-time record of 3,125–2,962 (.513).[2][3] This list documents players and teams who hold records set in various statistical areas during single games, entire seasons, or their team careers.
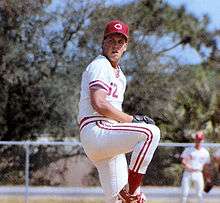
_(cropped).jpg)
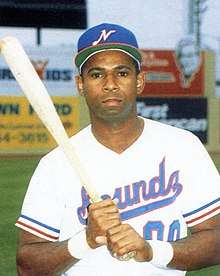
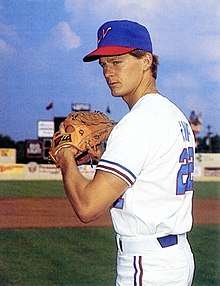
Of the nine Sounds who hold the 19 career records tracked by the team, Tim Dillard holds the most, with seven. He is followed by Skeeter Barnes and Chad Hermansen, with three each; and Keith Brown, Mark Corey, Hugh Kemp, Otis Nixon, Tike Redman, and Joey Wendle, with one each. Dillard holds the most franchise records, with eight. He is followed by Jamie Werly, with six; and Steve Balboni and Skeeter Barnes, who hold four records each.
Combined, the team and individual players hold 32 league records: 14 in the Southern League, one in the American Association, and 17 in the Pacific Coast League.[4][5] Individual players hold seven Southern League, one American Association, and two Pacific Coast League records.[4][5] The franchise set the Southern League season attendance record in 1980 and the single-game attendance record in 1982,[1][6] both of which still stand.[7] Many of the Pacific Coast League records were set on May 5–6, 2006, when the Sounds participated in a 24-inning game against the New Orleans Zephyrs, which matched the longest game, in terms of innings played, in the league's history.[8]
Table key
| * | Tie between two or more players/teams |
|---|---|
| § | Southern League record |
| American Association record | |
| Pacific Coast League record |
Individual career records
These are records of players who led in distinct statistical categories during their career with the Sounds.[9]
Career batting
| Statistic | Player | Record | Sounds career | Ref. |
|---|---|---|---|---|
| Games played | Skeeter Barnes | 514 | 1979, 1988–1990 | [10] |
| At bats | Skeeter Barnes | 1,848 | 1979, 1988–1990 | [10] |
| Runs | Chad Hermansen | 303 | 1998–2002 | [11] |
| Hits | Skeeter Barnes | 517 | 1979, 1988–1990 | [10] |
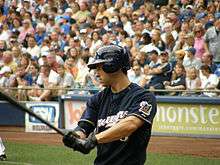
| Doubles | Joey Wendle | 102 | 2015–2017 | [12] |
| Triples | Tike Redman | 32 | 2000–2003, 2009 | [13] |
| Home runs | Chad Hermansen | 92 | 1998–2002 | [11] |
| Runs batted in | Chad Hermansen | 286 | 1998–2002 | [11] |
| Stolen bases | Otis Nixon | 133 | 1981–1982 | [14] |
Career pitching
| Statistic | Player | Record | Sounds career | Ref. |
|---|---|---|---|---|
| Wins | Tim Dillard | 48 | 2007–2014, 2019 | [15] |
| Losses | Keith Brown | 38 | 1988–1992 | [16] |
| Games pitched | Tim Dillard | 242 | 2007–2014, 2019 | [15] |
| Games started | Hugh Kemp | 73 | 1987–1989 | [17] |
| Saves | Mark Corey | 46 | 2003–2004 | [18] |
| Innings pitched | Tim Dillard | 710 | 2007–2014, 2019 | [15] |
| Runs allowed | Tim Dillard | 395 | 2007–2014, 2019 | [15] |
| Home runs allowed | Tim Dillard | 62 | 2007–2014, 2019 | [15] |
| Walks | Tim Dillard | 233 | 2007–2014, 2019 | [15] |
| Strikeouts | Tim Dillard | 437 | 2007–2014, 2019 | [15] |
Individual single-season records
These are records of individual players who led in distinct statistical categories during a single season.[19]
Single-season batting

| Statistic | Player | Record | Season | Ref. |
|---|---|---|---|---|
| Batting average | Bruce Fields | .368 | 1986 | [20] |
| Games played | Skeeter Barnes | 145* | 1979 | [10] |
| Games played | Gene Menees | 145* | 1979 | [21] |
| At bats | Norberto Martin | 580 | 1993 | [22] |
| Runs | Ted Wilborn | 106 | 1981 | [23] |
| Hits | Norberto Martin | 179 | 1993 | [22] |
| Total bases | Steve Balboni | 288* | 1980 | [24] |
| Total bases | Brian Dayett | 288* | 1982 | [25] |
| Doubles | Joey Wendle | 42 | 2015 | [12] |
| Triples | Jorge Mateo | 16 | 2018 | [26] |
| Home runs | Steve Balboni | 34* | 1980 | [24] |
| Home runs | Brian Dayett | 34* | 1982 | [25] |
| Runs batted in | Steve Balboni | 122 | 1980 | [24] |
| Sacrifice hits | Alcides Escobar | 19 | 2009 | [27] |
| Sacrifice flies | Nate Chapman | 9* | 1982 | [28] |
| Sacrifice flies | Iván Cruz | 9* | 1999 | [29] |
| Sacrifice flies | Mendy López | 9* | 2002 | [30] |
| Sacrifice flies | Steve Lombardozzi Jr. | 9* | 2018 | [31] |
| Hit by pitch | Drew Denson | 35 | 1994 | [32] |
| Walks | Otis Nixon | 110 | 1980 | [14] |
| Strikeouts | Sheldon Neuse | 172 | 2018 | [33] |
| Stolen bases | Otis Nixon | 72 | 1981 | [14] |
Single-season pitching
| Statistic | Player | Record | Season | Ref. |
|---|---|---|---|---|
| Wins | Clay Christiansen | 16* | 1982 | [34] |
| Wins | Stefan Wever | 16* | 1982 | [35] |
| Losses | Zach Kroenke | 16 | 2013 | [36] |
| Earned run average | Chris Hammond | 2.17 | 1990 | [37] |
| Games pitched | Geoff Combe | 66 | 1978 | [38] |
| Games started | Ben Callahan | 29* | 1982 | [39] |
| Games started | Clay Christiansen | 29* | 1982 | [34] |
| Games started | Stefan Wever | 29* | 1982 | [35] |
| Games started | Luis Vasquez | 29* | 1989 | [40] |
| Games started | Rodney Imes | 29* | 1990 | [41] |
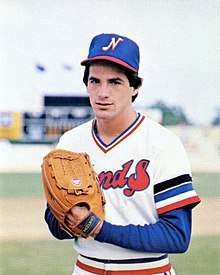
| Complete games | Jamie Werly | 18 | 1981 | [42] |
| Saves | Mark Corey | 30 | 2003 | [18] |
| Innings pitched | Jamie Werly | 2221⁄3 | 1981 | [42] |
| Runs allowed | Ben Callahan | 109 | 1982 | [39] |
| Earned runs | Tony McKnight | 102 | 2002 | [43] |
| Home runs allowed | James Baldwin | 27* | 1995 | [44] |
| Home runs allowed | Jeff Housman | 27* | 2005 | [45] |
| Hit batsmen | Tim Dillard | 20 | 2019 | [15] |
| Walks | Mike Bertotti | 105 | 1997 | [46] |
| Strikeouts | Jamie Werly | 193 | 1981 | [42] |
| Wild pitches | Clay Christiansen | 18 | 1982 | [34] |
Individual single-game records
These are records of individual players who led in distinct statistical categories during a single game.[47][48]
Single-game batting
| Statistic | Player | Record | Date | Opponent |
|---|---|---|---|---|
| At bats | Chris Barnwell | 11 | May 5, 2006 | New Orleans Zephyrs |
| Runs | Adrian Brown | 5* | May 12, 1999 | Tucson Sidewinders |
| Runs | Erick Almonte | 5* | July 5, 2011 | Memphis Redbirds |
| Runs | Taylor Green | 5* | July 28, 2011 | Oklahoma City RedHawks |
| Hits | Various (7 players) | 5* | Various (7 occasions) | — |
| Doubles | Tim Laker | 4 | August 30, 1998 | New Orleans Zephyrs |
| Triples | Various (13 players) | 2* | Various (13 occasions) | — |
| Home runs | Steve Balboni | 3* | May 1, 1980 | Knoxville Blue Jays |
| Home runs | Dan Pasqua | 3* | September 3, 1984 | Memphis Chicks |
| Home runs | Darnell Coles | 3* | April 10, 1992 | Denver Zephyrs |
| Home runs | Craig Wilson | 3* | June 6, 2000 | Tucson Sidewinders |
| Home runs | Ryan Braun | 3* | April 14, 2007 | New Orleans Zephyrs |
| Home runs | Russell Branyan | 3* | May 16, 2008 | New Orleans Zephyrs |
| Home runs | Matt Chapman | 3* | September 3, 2016 | New Orleans Zephyrs |
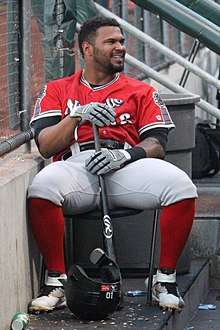
| Runs batted in | Anthony García | 8 | July 17, 2018 | Omaha Storm Chasers |
| Stolen bases | Otis Nixon | 4 | August 31, 1981 | Chattanooga Lookouts |
| Walks | Various (20 players) | 4* | Various (20 occasions) | — |
| Strikeouts | Brad Nelson | 7 | May 5, 2006 | New Orleans Zephyrs |
| Strikeouts (9 inn.) | Various (81 players) | 4* | Various (81 occasions) | — |
Single-game pitching
| Statistic | Player | Record | Date | Opponent |
|---|---|---|---|---|
| Strikeouts | Jamie Werly | 15* | August 28, 1981 | Charlotte O's |
| Strikeouts | Luis Vasquez | 15* | June 29, 1989 | Columbus Clippers |
| Strikeouts | John Wasdin | 15* | April 7, 2003 | Albuquerque Isotopes |
| Walks | Bryan Kelly | 10* | May 4, 1986 | Buffalo Bisons |
| Walks | Chris Hammond | 10* | May 26, 1989 | Pawtucket Red Sox |
| Runs allowed | Jamie Werly | 14 | August 18, 1981 | Birmingham Barons |
| Hits allowed | Jamie Werly | 16 | August 18, 1981 | Birmingham Barons |
Team season records
These are records of Sounds teams with the best and worst performances in distinct statistical categories during a single season.[19]
Season general
| Statistic | High | Season(s) | Low | Season(s) |
|---|---|---|---|---|
| Wins | 97 | 1980 | 57 | 2013 |
| Losses | 87 | 2013 | 46 | 1980 |
| Winning percentage | .678 | 1980 | .396 | 2013 |
| Streaks (win/loss) | 15* | 1999, 2018 | 12 | 1987 |
| Home wins | 51 | 1980 | 28 | 2000 |
| Home losses | 43 | 2000 | 20 | 1980 |
| Home winning percentage | .718 | 1980 | .394 | 2000 |
| Road wins | 47 | 2016 | 23 | 1986 |
| Road losses | 48* | 1986, 2013 | 23 | 2016 |
| Road winning percentage | .671 | 2016 | .324 | 1986 |
| Extra-inning games | 17* | 1980, 1988, 2004, 2012 | 5 | 2014 |
| Extra-inning wins | 14 | 1980 | 1* | 2013, 2014 |
| Extra-inning losses | 11* | 1986, 2004, 2012 | 3 | 1980 |
| Extra-inning winning percentage | .824 | 1980 | .100 | 2013 |
| One-run games | 52 | 2011 | 29 | 2019 |
| One-run wins | 32 | 1980 | 13 | 2008 |
| One-run losses | 31 | 2006 | 12* | 1989, 2019 |
| One-run winning percentage | .707 | 1989 | .342 | 2008 |
Season batting
| Statistic | High | Season(s) | Low | Season(s) |
|---|---|---|---|---|
| Batting average | .289 | 1999 | .251 | 1988 |
| At bats | 4,926 | 1992 | 4,413 | 1978 |
| Runs | 806 | 1999 | 489 | 1978 |
| Hits | 1,383 | 2011 | 1,100 | 1978 |
| Total bases | 2,266 | 1999 | 1,458 | 1978 |
| Doubles | 292 | 1999 | 172 | 1991 |
| Triples | 60* | 1979, 1980 | 18 | 2002 |
| Home runs | 183 | 1999 | 36 | 1978 |
| Runs batted in | 761 | 1999 | 421 | 1978 |
| Sacrifice hits | 92 | 2009 | 13 | 2019 |
| Sacrifice flies | 54* | 1986, 1999 | 23 | 1991 |
| Hit by pitch | 76 | 2019 | 23* | 1985, 1988 |
| Walks | 680 | 1984 | 368 | 1996 |
| Intentional walks | 48 | 1979 | 7 | 2019 |
| Strikeouts | 1,222 | 2018 | 624 | 1987 |
| Stolen bases | 205 | 1981 | 57 | 2016 |
| Caught stealing | 86 | 1980 | 21 | 2016 |
| Runners left on base | 1,156 | 1984 | 917 | 2014 |
Season pitching
| Statistic | High | Season(s) | Low | Season(s) |
|---|---|---|---|---|
| Earned run average | 5.48 | 2019 | 3.13 | 1980 |
| Complete games | 63 | 1983 | 1* | 2014, 2019 |
| Shutouts | 14 | 1989 | 1 | 1999 |
| Saves | 46 | 1994 | 12 | 1983 |
| Innings pitched | 1,295 | 1992 | 1,167 | 1978 |
| Hits allowed | 1,364 | 2004 | 1,076 | 1978 |
| Runs allowed | 814 | 2019 | 520 | 1978 |
| Earned runs | 735 | 2019 | 421 | 1978 |
| Home runs allowed | 175 | 2019 | 54 | 1978 |
| Hit batsmen | 96 | 2019 | 15 | 1979 |
| Walks | 666 | 1984 | 356 | 2002 |
| Intentional walks | 79§ | 1978 | 3 | 2018 |
| Strikeouts | 1,236 | 2014 | 708 | 1983 |
| Wild pitches | 91 | 2000 | 46 | 1992 |
| Balks | 71 | 1988 | 2 | 2006 |
Season fielding
| Statistic | High | Season(s) | Low | Season(s) |
|---|---|---|---|---|
| Fielding percentage | .984 | 2007 | .958 | 1984 |
| Putouts | 3,885 | 1992 | 3,504 | 1978 |
| Assists | 1,657 | 1982 | 1,273 | 2019 |
| Errors | 240§ | 1984 | 86 | 2007 |
| Double plays | 168 | 2010 | 90 | 1979 |
| Triple plays | 2 | 2011 | 0* | 1978, 1979, 1980, 1981, 1983, 1984, 1985, 1987, 1988, 1989, 1990, 1992, 1993, 1995, 1996, 1997, 1998, 1999, 2001, 2002, 2003, 2004, 2006, 2007, 2009, 2010, 2014, 2016, 2017, 2018 2019 |
| Passed balls | 30 | 2013 | 3 | 2019 |
Team single-game records
These are records of Sounds teams which led in distinct statistical categories during a single game.[47][48]
Single-game batting
| Statistic | Record | Date | Opponent |
|---|---|---|---|
| At bats | 81 | May 5, 2006 | New Orleans Zephyrs |
| Runs | 20* | May 31, 1981 | Knoxville Blue Jays |
| Runs | 20* | May 20, 2000 | Colorado Springs Sky Sox |
| Hits | 24* | May 20, 2000 | Colorado Springs Sky Sox |
| Hits | 24* | May 21, 2000 | Colorado Springs Sky Sox |
| Hits | 24* | August 4, 2011 | Colorado Springs Sky Sox |
| Doubles | 8* | June 2, 1981 | Birmingham Barons |
| Doubles | 8* | May 22, 1994 | Oklahoma City 89ers |
| Doubles | 8* | May 1, 2002 | Oklahoma RedHawks |
| Doubles | 8* | May 27, 2003 | Iowa Cubs |
| Doubles | 8* | August 10, 2011 | Reno Aces |
| Doubles | 8* | May 27, 2015 | Sacramento River Cats |
| Triples | 4* | May 1, 1987 | Denver Zephyrs |
| Triples | 4* | June 25, 1990 | Oklahoma City 89ers |
| Home runs | 6 | July 30, 1999 | Memphis Redbirds |
| Stolen bases | 7 | June 22, 1990 | Denver Zephyrs |
| Stolen bases | 7 | July 25, 2009 | Oklahoma City RedHawks |
| Walks | 13 | June 29, 2002 | Iowa Cubs |
| Strikeouts | 29 | May 5, 2006 | New Orleans Zephyrs |
| Strikeouts (9 inn.) | 17* | May 20, 1999 | Iowa Cubs |
| Strikeouts (9 inn.) | 17* | August 14, 2005 | Memphis Redbirds |
| Strikeouts (9 inn.) | 17* | May 30, 2006 | Iowa Cubs |
| Strikeouts (9 inn.) | 17* | May 3, 2013 | Round Rock Express |
| Strikeouts (9 inn.) | 17* | May 10, 2013 | Fresno Grizzlies |
| Runners left on base | 22 | May 5, 2006 | New Orleans Zephyrs |
| Runners left on base (9 inn.) | 20 | April 18, 1979 | Jacksonville Suns |
Single-game pitching
| Statistic | Record | Date | Opponent |
|---|---|---|---|
| Runs allowed | 20* | August 19, 2013 | Round Rock Express |
| Runs allowed | 20* | August 25, 2014 | Sacramento River Cats |
| Hits allowed | 24* | May 27, 2012 | Round Rock Express |
| Hits allowed | 24* | August 25, 2014 | Sacramento River Cats |
| Hits allowed | 24* | May 3, 2019 | Memphis Redbirds |
| Walks | 15 | April 28, 2019 | Iowa Cubs |
| Strikeouts | 20 | June 26, 1993 | Oklahoma City 89ers |
Attendance records
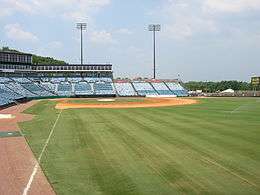
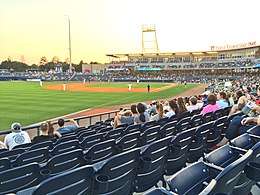
These are records of attendance at Sounds home games.[49][50] The team has had two home ballparks: Herschel Greer Stadium (1978–2014) and First Horizon Park (2015–present).
| Season | Attendance | Openings | Average | Cumulative total |
|---|---|---|---|---|
| 1978 | 380,159 | 71 | 5,354 | 380,159 |
| 1979 | 515,488 | 70 | 7,364 | 895,647 |
| 1980 | 575,676§ | 71 | 8,108 | 1,471,323 |
| 1981 | 567,994 | 74 | 7,676 | 2,039,317 |
| 1982 | 532,449 | 75 | 7,099 | 2,571,766 |
| 1983 | 500,048 | 77 | 6,494 | 3,071,814 |
| 1984 | 376,440 | 76 | 4,953 | 3,448,254 |
| 1985 | 364,225 | 72 | 5,059 | 3,812,479 |
| 1986 | 364,614 | 69 | 5,284 | 4,177,093 |
| 1987 | 378,715 | 69 | 5,489 | 4,555,808 |
| 1988 | 317,785 | 70 | 4,540 | 4,873,593 |
| 1989 | 457,854 | 73 | 6,272 | 5,331,447 |
| 1990 | 605,122 | 76 | 7,962 | 5,936,569 |
| 1991 | 454,575 | 72 | 6,651 | 6,391,144 |
| 1992 | 489,991 | 72 | 6,805 | 6,881,135 |
| 1993 | 438,745 | 72 | 6,094 | 7,319,880 |
| 1994 | 300,821 | 72 | 4,178 | 7,620,701 |
| 1995 | 355,133 | 72 | 4,932 | 7,975,834 |
| 1996 | 303,407 | 72 | 4,214 | 8,279,241 |
| 1997 | 269,186 | 72 | 3,739 | 8,548,427 |
| 1998 | 323,068 | 72 | 4,487 | 8,871,495 |
| 1999 | 335,901 | 71 | 4,731 | 9,207,396 |
| 2000 | 269,682 | 69 | 3,908 | 9,477,078 |
| 2001 | 305,385 | 69 | 4,426 | 9,782,463 |
| 2002 | 322,059 | 69 | 4,668 | 10,104,522 |
| 2003 | 387,345 | 67 | 5,781 | 10,491,867 |
| 2004 | 405,536 | 67 | 6,053 | 10,897,403 |
| 2005 | 419,412 | 69 | 6,078 | 11,316,815 |
| 2006 | 410,569 | 69 | 5,950 | 11,727,384 |
| 2007 | 411,959 | 70 | 5,885 | 12,139,343 |
| 2008 | 354,662 | 67 | 5,293 | 12,494,005 |
| 2009 | 305,434 | 68 | 4,492 | 12,799,439 |
| 2010 | 319,235 | 67 | 4,765 | 13,118,674 |
| 2011 | 335,143 | 69 | 4,857 | 13,453,817 |
| 2012 | 321,042 | 67 | 4,792 | 13,774,859 |
| 2013 | 355,003 | 70 | 5,071 | 14,129,892 |
| 2014 | 323,961 | 66 | 4,909 | 14,453,823 |
| 2015 | 565,548 | 71 | 7,965 | 15,019,371 |
| 2016 | 504,060 | 71 | 7,099 | 15,523,431 |
| 2017 | 593,679 | 67 | 8,861 | 16,117,110 |
| 2018 | 603,135 | 70 | 8,616 | 16,720,245 |
| 2019 | 578,291 | 67 | 8,631 | 17,298,536 |
| Totals | 17,298,536 | 2,959 | 5,846 | — |
Miscellaneous records
These are records of individual players and Sounds teams that do not fit into any of the preceding categories.[4][5]
Individual
.jpg)
| Statistic | Player | Record | Date(s) | Opponent | Ref(s). |
|---|---|---|---|---|---|
| Intentional walks (inning; batter) | Geoff Combe | 3§* | April 17, 1978 | Knoxville Sox | [51] |
| Intentional walks (season; batter) | Geoff Combe | 18§ | 1978 | — | [6] |
| Wild pitches (game) | Bruce Berenyi | 5§* | May 23, 1978 | Columbus Astros | [4][51] |
| Games as catcher (season) | Dave Van Gorder | 131§* | 1979 | — | [52] |
| Singles (season) | Buck Showalter | 155§ | 1980 | — | [53] |
| Errors by a shortstop (season) | Otis Nixon | 56§ | 1981 | — | [52] |
| Putouts by an outfielder (game) | Jeff Williams | 12§* | August 31, 1984 | Memphis Chicks | [52] |
| Consecutive strikeouts (pitcher) | Scott Service | 10 | August 16/18, 1992 | Buffalo Bisons | [54] |
| Consecutive innings with no walks (pitcher) | Brian Meadows | 702⁄3 | July 17, 2002–July 18, 2003 | Various | [55] |
Team
| Statistic | Record | Date(s) | Opponent | Ref. |
|---|---|---|---|---|
| Composite winning percentage (minimum 1,000 games played) |
.550 (710–580)§ | 1978–1984 | — | [4] |
| Consecutive seasons in postseason | 6§* | 1979–1984 | — | [56] |
| Fewest one-run games lost (season) | 10§* | 1980 | — | [56] |
| Longest game (innings) | 24 | May 5, 2006 | New Orleans Zephyrs | [5] |
| Players used (game; both teams) | 40 | May 5, 2006 | New Orleans Zephyrs | [5] |
| Pitchers used (game) | 9 | May 5, 2006 | New Orleans Zephyrs | [5] |
| Pitchers used (game; both teams; 9 inn.) | 14 | April 11, 1998 | Colorado Springs Sky Sox | [57] |
| Pitchers used (game; both teams; 9 inn.) | 14 | June 24, 2003 | Colorado Springs Sky Sox | [57] |
| Pitchers used (game; both teams) | 17 | May 5, 2006 | New Orleans Zephyrs | [5] |
| Strikeouts (batting; game; both teams) | 48 | May 5, 2006 | New Orleans Zephyrs | [5] |
| Strikeouts (pitching; game; both teams) | 48 | May 5, 2006 | New Orleans Zephyrs | [5] |
| At bats (game; both teams) | 166 | May 5, 2006 | New Orleans Zephyrs | [5] |
| Assists (game) | 28 | May 5, 2006 | New Orleans Zephyrs | [5] |
| Assists (game; both teams) | 53 | May 5, 2006 | New Orleans Zephyrs | [5] |
| Highest attendance (game) | 22,315§ | August 18, 1982 | Columbus Astros | [6] |
| Lowest attendance (game) | 0 | June 14, 2008 | Iowa Cubs | [4] |
References
- Weiss, Bill; Wright, Marshall (2001). "Top 100 Teams". Minor League Baseball. Retrieved August 22, 2014.
- "Nashville Sounds Yearly Results". Nashville Sounds. Minor League Baseball. Retrieved September 2, 2019.
- "Postseason History" (PDF). 2018 Nashville Sounds Media Guide. Minor League Baseball. 2018. pp. 178–179. Archived (PDF) from the original on April 7, 2015. Retrieved February 6, 2019.
- "Nashville Baseball History" (PDF). 2015 Nashville Sounds Media Guide. Minor League Baseball. 2015. p. 147. Archived from the original (PDF) on April 7, 2015. Retrieved April 7, 2015.
- "24-Inning Game – May 5-6, 2006" (PDF). 2015 Nashville Sounds Media Guide. Minor League Baseball. 2015. p. 152. Archived from the original (PDF) on April 7, 2015. Retrieved April 7, 2015.
- "League Records (1964–present)". 2019 Southern League Media Guide. Southern League. pp. 73–94. Retrieved April 18, 2020.
- "Historical Attendance". Southern League. Minor League Baseball. Retrieved April 3, 2015.
- "Sounds, Zephyrs Tie PCL Record for Longest Game". ESPN. May 6, 2006. Archived from the original on April 3, 2015. Retrieved April 3, 2015.
- "Nashville Sounds Career Leaders". Nashville Sounds. Minor League Baseball. Retrieved February 6, 2019.
- "Skeeter Barnes Minor League Statistics and History". Baseball-Reference. Sports Reference. Retrieved April 3, 2015.
- "Chad Hermansen Minor League Statistics and History". Baseball-Reference. Sports Reference. Retrieved April 3, 2015.
- "Joey Wendle Minor League Statistics and History". Baseball-Reference. Sports Reference. Retrieved August 1, 2017.
- "Tike Redman Minor League Statistics and History". Baseball-Reference. Sports Reference. Retrieved April 3, 2015.
- "Otis Nixon Minor League Statistics and History". Baseball-Reference. Sports Reference. Retrieved April 3, 2015.
- "Tim Dillard Minor League Statistics and History". Baseball-Reference. Sports Reference. Retrieved September 1, 2019.
- "Keith Brown Minor League Statistics and History". Baseball-Reference. Sports Reference. Retrieved April 3, 2015.
- "Hugh Kemp Minor League Statistics and History". Baseball-Reference. Sports Reference. Retrieved April 3, 2015.
- "Mark Corey Minor League Statistics and History". Baseball-Reference. Sports Reference. Retrieved April 3, 2015.
- "Nashville Sounds Single-Season Records". Nashville Sounds. Minor League Baseball. Retrieved February 6, 2019.
- "Bruce Fields Minor League Statistics and History". Baseball-Reference. Sports Reference. Retrieved April 3, 2015.
- "Gene Menees Minor League Statistics and History". Baseball-Reference. Sports Reference. Retrieved April 3, 2015.
- "Norberto Martin Minor League Statistics and History". Baseball-Reference. Sports Reference. Retrieved April 3, 2015.
- "Ted Wilborn Minor League Statistics and History". Baseball-Reference. Sports Reference. Retrieved April 3, 2015.
- "Steve Balboni Minor League Statistics and History". Baseball-Reference. Sports Reference. Retrieved April 3, 2015.
- "Brian Dayett Minor League Statistics and History". Baseball-Reference. Sports Reference. Retrieved April 3, 2015.
- "Jorge Mateo Minor League Statistics and History". Baseball-Reference. Sports Reference. Retrieved September 3, 2018.
- "Alcides Escobar Minor League Statistics and History". Baseball-Reference. Sports Reference. Retrieved April 3, 2015.
- "Nate Chapman Minor League Statistics and History". Baseball-Reference. Sports Reference. Retrieved April 3, 2015.
- "Iván Cruz Minor League Statistics and History". Baseball-Reference. Sports Reference. Retrieved April 7, 2015.
- "Mendy López Minor League Statistics and History". Baseball-Reference. Sports Reference. Retrieved April 3, 2015.
- "Steve Lombardozzi Minor League Statistics and History". Baseball-Reference. Retrieved February 6, 2019.
- "Drew Denson Minor League Statistics and History". Baseball-Reference. Sports Reference. Retrieved April 3, 2015.
- "Sheldon Neuse Minor League Statistics and History". Baseball-Reference. Sports Reference. Retrieved September 22, 2018.
- "Clay Christiansen Minor League Statistics and History". Baseball-Reference. Sports Reference. Retrieved April 3, 2015.
- "Stefan Wever Minor League Statistics and History". Baseball-Reference. Sports Reference. Retrieved April 3, 2015.
- "Zach Kroenke Minor League Statistics and History". Baseball-Reference. Sports Reference. Retrieved April 3, 2015.
- "Chris Hammond Minor League Statistics and History". Baseball-Reference. Sports Reference. Retrieved April 3, 2015.
- "Geoff Combe Minor League Statistics and History". Baseball-Reference. Sports Reference. Retrieved April 3, 2015.
- "Ben Callahan Minor League Statistics and History". Baseball-Reference. Sports Reference. Retrieved April 3, 2015.
- "Luis Vasquez Minor League Statistics and History". Baseball-Reference. Sports Reference. Retrieved April 3, 2015.
- "Rodney Imes Minor League Statistics and History". Baseball-Reference. Sports Reference. Retrieved April 3, 2015.
- "Jamie Werly Minor League Statistics and History". Baseball-Reference. Sports Reference. Retrieved April 3, 2015.
- "Tony McKnight Minor League Statistics and History". Baseball-Reference. Sports Reference. Retrieved April 3, 2015.
- "James Baldwin Minor League Statistics and History". Baseball-Reference. Sports Reference. Retrieved April 3, 2015.
- "Jeff Housman Minor League Statistics and History". Baseball-Reference. Sports Reference. Retrieved April 3, 2015.
- "Mike Bertotti Minor League Statistics and History". Baseball-Reference. Sports Reference. Retrieved April 3, 2015.
- "Nashville Sounds Single-Game Records". Nashville Sounds. Minor League Baseball. Retrieved February 6, 2019.
- "Single-Game Team and Individual Records" (PDF). 2018 Nashville Sounds Media Guide. Minor League Baseball. 2018. p. 158. Archived (PDF) from the original on April 7, 2015. Retrieved February 6, 2019.
- "Franchise Year-By-Year Attendance" (PDF). 2018 Nashville Sounds Media Guide. Minor League Baseball. 2018. p. 156. Archived (PDF) from the original on April 7, 2015. Retrieved February 6, 2019.
- "Pacific Coast League Attendance". Pacific Coast League. Minor League Baseball. Retrieved February 6, 2019.
- "Individual Pitching Records". Southern League. Minor League Baseball. Retrieved February 18, 2019.
- "Individual Fielding Records". Southern League. Minor League Baseball. Retrieved February 18, 2019.
- "Individual Batting Records". Southern League. Minor League Baseball. Retrieved February 18, 2019.
- "Scott Service Minor League Statistics and History". Baseball-Reference. Sports Reference. Retrieved April 3, 2015.
- "Brian Meadows Minor League Statistics and History". Baseball-Reference. Sports Reference. Retrieved April 3, 2015.
- "General Team Records". Southern League. Minor League Baseball. Retrieved February 18, 2019.
- General Team Records. 2017 Pacific Coast League Sketch and Record Book. Pacific Coast League. 2017. p. 184.