Lift-to-drag ratio
In aerodynamics, the lift-to-drag ratio (or L/D ratio) is the amount of lift generated by a wing or vehicle, divided by the aerodynamic drag it creates by moving through air. A greater or more favorable L/D ratio is typically one of the major goals of aircraft design; since a particular aircraft's required lift is set by its weight, delivering that lift with lower drag results directly in better fuel economy in aircraft, climb performance, and glide ratio.

The term is calculated for any particular airspeed by measuring the lift generated, then dividing by the drag at that speed. These vary with speed, so the results are typically plotted on a 2 dimensional graph. In almost all cases the graph forms a U-shape, due to the two main components of drag.
Lift-to-drag ratios can be determined by flight test, by calculation or by testing in a wind tunnel.
Drag
Lift-induced drag is a component of total drag that occurs whenever a finite span wing generates lift. At low speeds an aircraft has to generate lift with a higher angle of attack, thereby resulting in a greater induced drag. This term dominates the low-speed side of the graph of lift versus velocity.
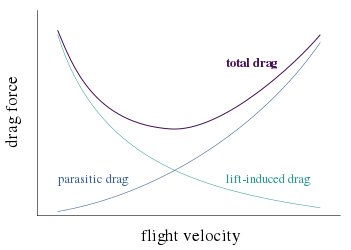

Form drag is caused by movement of the aircraft through air. This type of drag, known also as air resistance or profile drag varies with the square of speed (see drag equation). For this reason profile drag is more pronounced at greater speeds, forming the right side of the lift/velocity graph's U shape. Profile drag is lowered primarily by streamlining and reducing cross section.
Lift, like drag, increases as the square of the velocity and the ratio of lift to drag is often plotted in terms of the lift and drag coefficients CL and CD. Such graphs are referred to as drag polars. Speed increases from left to right. The lift/drag ratio is given by the slope from the origin to some point on this curve and so the maximum L/D ratio does not occur at the point of least drag, the leftmost point. Instead it occurs at a slightly greater speed. Designers will typically select a wing design which produces an L/D peak at the chosen cruising speed for a powered fixed-wing aircraft, thereby maximizing economy. Like all things in aeronautical engineering, the lift-to-drag ratio is not the only consideration for wing design. Performance at a high angle of attack and a gentle stall are also important.
Glide ratio
As the aircraft fuselage and control surfaces will also add drag and possibly some lift, it is fair to consider the L/D of the aircraft as a whole. As it turns out, the glide ratio, which is the ratio of an (unpowered) aircraft's forward motion to its descent, is (when flown at constant speed) numerically equal to the aircraft's L/D. This is especially of interest in the design and operation of high performance sailplanes, which can have glide ratios almost 60 to 1 (60 units of distance forward for each unit of descent) in the best cases, but with 30:1 being considered good performance for general recreational use. Achieving a glider's best L/D in practice requires precise control of airspeed and smooth and restrained operation of the controls to reduce drag from deflected control surfaces. In zero wind conditions, L/D will equal distance traveled divided by altitude lost. Achieving the maximum distance for altitude lost in wind conditions requires further modification of the best airspeed, as does alternating cruising and thermaling. To achieve high speed across country, glider pilots anticipating strong thermals often load their gliders (sailplanes) with water ballast: the increased wing loading means optimum glide ratio at greater airspeed, but at the cost of climbing more slowly in thermals. As noted below, the maximum L/D is not dependent on weight or wing loading, but with greater wing loading the maximum L/D occurs at a faster airspeed. Also, the faster airspeed means the aircraft will fly at greater Reynolds number and this will usually bring about a lower zero-lift drag coefficient.
Theory
Mathematically, the maximum lift-to-drag ratio can be estimated as:

where AR is the aspect ratio, the span efficiency factor, a number less than but close to unity for long, straight edged wings, and the zero-lift drag coefficient.


Most importantly, the maximum lift-to-drag ratio is independent of the weight of the aircraft, the area of the wing, or the wing loading.
It can be shown that two main drivers of maximum lift-to-drag ratio for a fixed wing aircraft are wingspan and total wetted area. One method for estimating the zero-lift drag coefficient of an aircraft is the equivalent skin-friction method. For a well designed aircraft, zero-lift drag (or parasite drag) is mostly made up of skin friction drag plus a small percentage of pressure drag caused by flow separation. The method uses the equation:

where is the equivalent skin friction coefficient, is the wetted area and is the wing reference area. The equivalent skin friction coefficient accounts for both separation drag and skin friction drag and is a fairly consistent value for aircraft types of the same class. Substituting this into the equation for maximum lift-to-drag ratio, along with the equation for aspect ratio (), yields the equation:


where b is wingspan. The term is known as the wetted aspect ratio. The equation demonstrates the importance of wetted aspect ratio in achieving an aerodynamically efficient design.

Supersonic/hypersonic lift to drag ratios
At very great speeds, lift to drag ratios tend to be lower. Concorde had a lift/drag ratio of about 7 at Mach 2, whereas a 747 is about 17 at about mach 0.85.
Dietrich Küchemann developed an empirical relationship for predicting L/D ratio for high Mach:[3]

where M is the Mach number. Windtunnel tests have shown this to be approximately accurate.
Examples of L/D ratios
- House sparrow: 4:1
- Herring gull 10:1
- Common tern 12:1
- Albatross 20:1
- Wright Flyer 8.3:1
- Boeing 747 in cruise 17.7:1.[4]
- Cruising Airbus A380 20:1[5]
- Concorde at takeoff and landing 4:1, increasing to 12:1 at Mach 0.95 and 7.5:1 at Mach 2[6]
- Helicopter at 100 kn (190 km/h) 4.5:1[7]
- Cessna 172 gliding 10.9:1[8]
- Cruising Lockheed U-2 25.6:1[9]
- Rutan Voyager 27:1
- Virgin Atlantic GlobalFlyer 37:1[10]
| Jetliner | cruise L/D | First flight |
|---|---|---|
| L1011-100 | 14.5 | Nov 16, 1970 |
| DC-10-40 | 13.8 | Aug 29, 1970 |
| A300-600 | 15.2 | Oct 28, 1972 |
| MD-11 | 16.1 | Jan 10, 1990 |
| B767-200ER | 16.1 | Sep 26, 1981 |
| A310-300 | 15.3 | Apr 3, 1982 |
| B747-200 | 15.3 | Feb 9, 1969 |
| B747-400 | 15.5 | Apr 29, 1988 |
| B757-200 | 15.0 | Feb 19, 1982 |
| A320-200 | 16.3 | Feb 22, 1987 |
| A330-300 | 18.1 | Nov 2, 1992 |
| A340-200 | 19.2 | Apr 1, 1992 |
| A340-300 | 19.1 | Oct 25, 1991 |
| B777-200 | 19.3 | Jun 12, 1994 |
For gliding flight, the L/D ratios are equal to the glide ratio (when flown at constant speed).
| Flight article | Scenario | L/D ratio/ glide ratio |
|---|---|---|
| Eta (glider) | Gliding | 70[12] |
| Great frigatebird | Soaring over the ocean | 15-22 at typical speeds[13] |
| Hang glider | Gliding | 15 |
| Air Canada Flight 143 (Gimli Glider) | a Boeing 767-200 with all engines failed caused by fuel exhaustion | ~12 |
| British Airways Flight 9 | a Boeing 747-200B with all engines failed caused by volcanic ash | ~15 |
| US Airways Flight 1549 | a Airbus A320-214 with all engines failed caused by bird strike | ~17 |
| Paraglider | High performance model | 11 |
| Helicopter | Autorotation | 4 |
| Powered parachute | Rectangular/elliptical parachute | 3.6/5.6 |
| Space Shuttle | Approach | 4.5[14] |
| Wingsuit | Gliding | 3 |
| Hypersonic Technology Vehicle 2 | Equilibrium hypersonic gliding estimate[15] | 2.6 |
| Northern flying squirrel | Gliding | 1.98 |
| Sugar glider | Gliding | 1.82[16] |
| Space Shuttle | Hypersonic | 1[14] |
| Apollo CM | Reentry | 0.368[17] |
See also
- Gravity drag rockets can have an effective lift to drag ratio while maintaining altitude.
- Inductrack maglev has a greater lift/drag ratio than aircraft at sufficient speeds .
- Lift coefficient
- Range (aeronautics) range depends on the lift/drag ratio.
- Thrust specific fuel consumption the lift to drag determines the required thrust to maintain altitude (given the aircraft weight), and the SFC permits calculation of the fuel burn rate.
- Thrust-to-weight ratio
References
- Loftin, LK Jr. "Quest for performance: The evolution of modern aircraft. NASA SP-468". Retrieved 2006-04-22.
- Raymer, Daniel (2012). Aircraft Design: A Conceptual Approach (5th ed.). New York: AIAA.
- Aerospaceweb.org Hypersonic Vehicle Design
- Antonio Filippone. "Lift-to-Drag Ratios". Advanced topics in aerodynamics. Archived from the original on March 28, 2008.
- Cumpsty, Nicholas (2003). Jet Propulsion. Cambridge University Press. p. 4.
- Christopher Orlebar (1997). The Concorde Story. Osprey Publishing. p. 116. ISBN 9781855326675.
- Leishman, J. Gordon (24 April 2006). Principles of helicopter aerodynamics. Cambridge University Press. p. 230. ISBN 0521858607.
The maximum lift-to-drag ratio of the complete helicopter is about 4.5
- Cessna Skyhawk II Performance Assessment http://temporal.com.au/c172.pdf
- "U2 Developments transcript". Central Intelligence Agency. 1960. Lay summary – transcript.
- David Noland (February 2005). "The Ultimate Solo". Popular Mechanics.
- Rodrigo Martínez-Val; et al. (January 2005). "Historical evolution of air transport productivity and efficiency". 43rd AIAA Aerospace Sciences Meeting and Exhibit. doi:10.2514/6.2005-121.
- Eta aircraft Eta aircraft performances plots - accessed 2004-04-11
- Flight performance of the largest volant bird
- Space Shuttle Technical Conference pg 258
- http://scienceandglobalsecurity.org/archive/2015/09/hypersonic_boost-glide_weapons.html
- Jackson, Stephen M. (2000). "Glide angle in the genus Petaurus and a review of gliding in mammals". Mammal Review. 30 (1): 9–30. doi:10.1046/j.1365-2907.2000.00056.x. ISSN 1365-2907.
- Hillje, Ernest R., "Entry Aerodynamics at Lunar Return Conditions Obtained from the Flight of Apollo 4 (AS-501)," NASA TN D-5399, (1969).