LMS color space
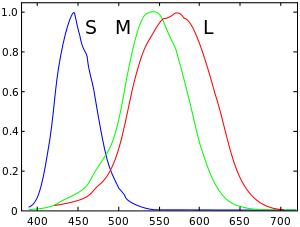
LMS (long, medium, short), is a color space which represents the response of the three types of cones of the human eye, named for their responsivity (sensitivity) peaks at long, medium, and short wavelengths.
The numerical range is generally not specified, except that the lower end is generally bounded by zero. It is common to use the LMS color space when performing chromatic adaptation (estimating the appearance of a sample under a different illuminant). It's also useful in the study of color blindness, when one or more cone types are defective.
XYZ to LMS
Typically, colors to be adapted chromatically will be specified in a color space other than LMS (e.g. sRGB). The chromatic adaptation matrix in the diagonal von Kries transform method, however, operates on tristimulus values in the LMS color space. Since colors in most colorspaces can be transformed to the XYZ color space, only one additional transformation matrix is required for any color space to be adapted chromatically: to transform colors from the XYZ color space to the LMS color space. However, many color adaption methods, or color appearance models (CAMs), use matrices to convert to spaces other than LMS (and sometimes refer to them as LMS or RGB or ργβ), and apply a von Kries-like diagonal matrix in that space.[1]
The CAT matrices for some CAMs in terms of CIEXYZ coordinates are presented here.
- Notes
- All tristimulus values are normally calculated using the CIE 1931 2° standard colorimetric observer.[1]
- Unless specified otherwise, the CAT matrices are normalized (the elements in a row add up to 1) so the tristimulus values for an equal-energy illuminant (X=Y=Z), like CIE Illuminant E, produce equal LMS values.[1]
Hunt, RLAB
The Hunt and RLAB color appearance models use the Hunt-Pointer-Estevez transformation matrix (MHPE) for conversion from CIE XYZ to LMS.[2][3][4] This is the transformation matrix which was originally used in conjunction with the von Kries transform method, and is therefore also called von Kries transformation matrix (MvonKries).
| Equal-energy illuminants: | |
| Normalized[5] to D65: |


CIECAM97s, LLAB
The original CIECAM97s color appearance model uses the Bradford transformation matrix (MBFD) (as does the LLAB color appearance model).[1] This is a “spectrally sharpened” transformation matrix (i.e. the L and M cone response curves are narrower and more distinct from each other). The Bradford transformation matrix was supposed to work in conjunction with a modified von Kries transform method which introduced a small non-linearity in the S (blue) channel. However, outside of CIECAM97s and LLAB this is often neglected and the Bradford transformation matrix is used in conjunction with the linear von Kries transform method, explicitly so in ICC profiles.[6]

A revised version of CIECAM97s switches back to a linear transform method and introduces a corresponding transformation matrix (MCAT97s):[7]


References
- Fairchild, Mark D. (2005). Color Appearance Models (2E ed.). Wiley Interscience. pp. 182–183, 227–230. ISBN 978-0-470-01216-1.
- Schanda, Jnos, ed. (2007-07-27). Colorimetry. p. 305. doi:10.1002/9780470175637. ISBN 9780470175637.
- Moroney, Nathan; Fairchild, Mark D.; Hunt, Robert W.G.; Li, Changjun; Luo, M. Ronnier; Newman, Todd (November 12, 2002). "The CIECAM02 Color Appearance Model". IS&T/SID Tenth Color Imaging Conference. Scottsdale, Arizona: The Society for Imaging Science and Technology. ISBN 0-89208-241-0.
- Ebner, Fritz (1998-07-01). "Derivation and modelling hue uniformity and development of the IPT color space". Theses: 129.
- "Welcome to Bruce Lindbloom's Web Site". brucelindbloom.com. Retrieved 23 March 2020.
- Specification ICC.1:2010 (Profile version 4.3.0.0). Image technology colour management — Architecture, profile format, and data structure, Annex E.3, pp. 102.
- Fairchild, Mark D. (2001). "A Revision of CIECAM97s for Practical Applications" (PDF). Color Research & Applications. Wiley Interscience. 26 (6): 418–427. doi:10.1002/col.1061.
- Fairchild, Mark. "Errata for COLOR APPEARANCE MODELS" (PDF).
The published MCAT02 matrix in Eq. 9.40 is incorrect (it is a version of the HuntPointer-Estevez matrix. The correct MCAT02 matrix is as follows. It is also given correctly in Eq. 16.2)