J-segment
J-segment is the European segments for passenger cars described as "sport utility cars (including off-road vehicles)".[1][2][3] It covers a broad category of vehicles ranging from crossovers (based on a passenger car platform), sports utility vehicles (based on a light truck platform) and off-road vehicles.[4]
Sales in the segment are currently increasing each year in Europe. In 2015, J-segment became the highest selling segment, with 28% market share.
Characteristics
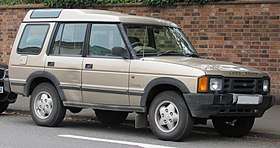
The vehicles covered by J-segment developed from early utilitarian off-road vehicles, however in recent years the majority of J-segment vehicles are based on passenger car platforms and often have limited off-road capability.
Vehicle sizes range from superminis (B-segment) to large luxury cars (F-segment).
- Sizes of J-segment vehicles

 Small family car-size:
Volkswagen Tiguan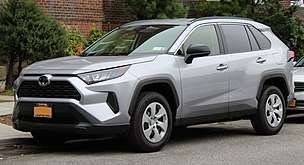 Large family car-size:
Toyota RAV4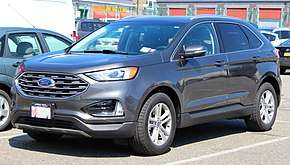
European sales figures
| 2019 rank | Manufacturer | Model | 2013 sales | 2014 sales | 2015 sales | 2016 sales | 2017 sales | 2018 sales | 2019 sales | % change (2018–2019) |
|---|---|---|---|---|---|---|---|---|---|---|
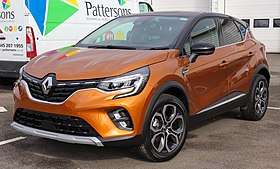
| 1 | Renault | Captur | 84,085 | 164,801 | 194,847 | 215,493 | 211,321 | 211,092 | 222,540 | |
| 2 | Dacia | Duster | 88,082 | 127,772 | 125,416 | 139,826 | 145,682 | 180,391 | 220,167 | |
| 3 | Volkswagen | T-Roc | — | — | — | — | 4,930 | 139,755 | 207,976 | |
| 4 | Peugeot | 2008 | 58,672 | 135,541 | 154,325 | 175,079 | 179,529 | 177,486 | 164,951 | |
| 5 | Ford | EcoSport | — | 12,890 | 40,084 | 57,294 | 63,150 | 110,574 | 120,376 | |
| 6 | Opel/Vauxhall | Crossland X | — | — | — | — | 38,964 | 95,180 | 114,721 | |
| 7 | Citroën | C3 Aircross | — | — | — | — | 16,982 | 110,394 | 112,089 | |
| 8 | SEAT | Arona | — | — | — | — | 6,070 | 88,730 | 110,648 | |
| 9 | Hyundai | Kona | — | — | — | — | 6,884 | 65,469 | 105,030 | |
| 10 | Volkswagen | T-Cross | — | — | — | — | — | — | 101,229 | |
| 11 | Fiat | 500X | — | 135 | 74,262 | 104,931 | 90,049 | 94,960 | 89,361 | |
| 12 | Suzuki | Vitara | — | — | 43,247 | 73,099 | 72,301 | 67,801 | 81,860 | |
| 13 | Opel/Vauxhall | Mokka | 70,768 | 127,437 | 163,246 | 164,340 | 169,886 | 120,537 | 79,693 | |
| 14 | Jeep | Renegade | — | 7,768 | 53,940 | 76,203 | 72,578 | 72,457 | 78,842 | |
| 15 | Kia | Stonic | — | — | — | — | 9,954 | 54,816 | 64,248 | |
| 16 | Mazda | CX-3 | — | — | 24,232 | 52,409 | 53,871 | 55,548 | 61,962 | |
| 17 | Kia | Niro | — | — | — | 8,562 | 33,972 | 44,225 | 57,337 | |
| 18 | Citroën | C4 Cactus | — | 28,974 | 78,888 | 71,378 | 56,245 | 57,637 | 52,600 | |
| 19 | Nissan | Juke | 106,411 | 97,538 | 102,574 | 98,108 | 91,774 | 68,773 | 47,519 | |
| 20 | Suzuki | S-Cross | 8,985 | 39,070 | 29,087 | 23,185 | 31,764 | 31,577 | 36,154 | |
| 21 | Mitsubishi | ASX | 26,468 | 35,295 | 45,228 | 39,241 | 39,160 | 30,958 | 30,622 | |
| 22 | Honda | HR-V | — | — | 7,621 | 33,064 | 29,375 | 25,920 | 21,747 | |
| 23 | Suzuki | Jimny | 10,713 | 10,787 | 12,271 | 13,184 | 14,710 | 10,438 | 16,605 | |
| 24 | Škoda | Kamiq | — | — | — | — | — | — | 13,240 | |
| 25 | Kia | Xceed | — | — | — | — | — | — | 10,599 | |
| 26 | MG | ZS | — | — | — | — | — | 5,376 | 9,872 | |
| 27 | SsangYong | Tivoli | — | — | 4,512 | 10,051 | 7,144 | 6,182 | 5,755 | |
| 28 | Kia | Soul | 3,202 | 10,261 | 16,326 | 13,599 | 12,437 | 11,214 | 5,122 | |
| 29 | Lada | Niva 4x4 | 1,670 | 1,542 | 1,652 | 1,915 | 1,997 | 2,687 | 2,961 | |
| 30 | SsangYong | XLV | — | — | — | 1,154 | 2,216 | 1,993 | 1,723 | |
| 31 | DR | DR3 | — | — | — | — | — | 236 | 736 | |
| 32 | DR | DR4 | — | — | — | — | — | 498 | 722 | |
| 33 | Haval | H2 | — | — | — | — | — | — | 110 | |
| 34 | Suzuki | SX4 | 28,106 | 14,126 | 3,161 | 489 | 393 | 10 | 14 | |
| Total | — | — | — | — | — | 1,432,225 | 1,508,768 | 2,076,829 | 2,401,326 |
| 2017 rank | Manufacturer | Model | 2013 sales | 2014 sales | 2015 sales | 2016 sales | 2017 sales | % change (2016–2017) |
|---|---|---|---|---|---|---|---|---|
| 1 | Nissan | Qashqai | 201,722 | 202,914 | 230,661 | 233,496 | 247,199 | |
| 2 | Volkswagen | Tiguan | 142,523 | 150,641 | 148,338 | 178,333 | 236,323 | |
| 3 | Peugeot | 3008 | 81,398 | 78,215 | 67,079 | 75,032 | 168,356 | |
| 4 | Hyundai | Tucson | — | — | 36,094 | 147,072 | 152,103 | |
| 5 | Ford | Kuga | 64,767 | 86,445 | 102,464 | 119,433 | 151,451 | |
| 6 | Kia | Sportage | 90,342 | 96,556 | 104,984 | 138,218 | 129,595 | |
| 7 | Renault | Kadjar | — | — | 49,520 | 130,090 | 111,705 | |
| 8 | Toyota | C-HR | — | — | — | 7,123 | 108,170 | |
| 9 | SEAT | Ateca | — | — | — | 22,928 | 74,692 | |
| 10 | Mazda | CX-5 | 49,883 | 57,289 | 56,179 | 55,345 | 59,499 | |
| 11 | Jeep | Compass | 6,572 | 4,829 | 616 | 457 | 15,591 | |
| 12 | Subaru | XV | 12,216 | 10,745 | 8,925 | 10,400 | 10,618 | |
| 13 | Opel/Vauxhall | Grandland X | — | — | — | — | 8,971 | |
| 14 | Škoda | Karoq | — | — | — | — | 5,891 | |
| 15 | Citroën | C4 Aircross | 11,822 | 12,142 | 11,771 | 9,217 | 4,901 | |
| 16 | Jeep | Wrangler | 5,619 | 5,302 | 6,059 | 4,259 | 3,670 | |
| 17 | SsangYong | Korando | 3,232 | 4,820 | 5,795 | 3,874 | 3,327 | |
| 18 | MG | GS | — | — | — | 583 | 974 | |
| 19 | Peugeot | 4008 | 3,972 | 2,533 | 2,442 | 2,036 | 793 | |
| 20 | Hyundai | ix35 | 88,831 | 93,540 | 84,264 | 11,041 | 772 | |
| 21 | Mitsubishi | Eclipse Cross | — | — | — | — | 674 | |
| 22 | Opel/Vauxhall | Antara | 15,380 | 8,461 | 6,746 | 2,058 | 552 | |
| 23 | DR | DR5 | 199 | 106 | 165 | 186 | 241 | |
| 24 | Chevrolet | Captiva | 13,216 | 2,928 | 59 | 12 | 1 | |
| Total | — | — | — | — | — | 1,152,779 | 1,493,277 |
| 2017 rank | Manufacturer | Model | 2013 sales | 2014 sales | 2015 sales | 2016 sales | 2017 sales | % change (2016–2017) |
|---|---|---|---|---|---|---|---|---|
| 1 | Toyota | RAV4 | 47,534 | 54,187 | 51,838 | 69,919 | 71,047 | |
| 2 | Nissan | X-Trail | 5,811 | 16,178 | 40,243 | 60,444 | 69,833 | |
| 3 | Škoda | Kodiaq | — | — | — | 671 | 53,967 | |
| 4 | Peugeot | 5008 II | — | — | — | 28,034 | 46,689 | |
| 5 | Mitsubishi | Outlander | 25,960 | 33,744 | 46,581 | 40,578 | 36,281 | |
| 6 | Honda | CR-V | 47,596 | 49,182 | 46,967 | 43,456 | 34,616 | |
| 7 | Renault | Koleos | 8,404 | 7,418 | 4,675 | 186 | 13,232 | |
| 8 | Subaru | Forester | 14,579 | 13,889 | 14,428 | 12,607 | 13,185 | |
| 9 | Jeep | Cherokee | 421 | 8,629 | 12,442 | 9,740 | 5,531 | |
| 10 | Volkswagen | Tiguan Allspace | — | — | — | — | 2,792 | |
| 11 | Fiat | Freemont | 18,825 | 17,389 | 13,821 | 3,034 | 2 | |
| Total | — | — | — | — | — | 240,635 | 347,175 |
| 2017 rank | Manufacturer | Model | 2013 sales | 2014 sales | 2015 sales | 2016 sales | 2017 sales | % change (2016–2017) |
|---|---|---|---|---|---|---|---|---|
| 1 | Ford | Edge | — | — | — | 6,200 | 16,000 | |
| 2 | Kia | Sorento | 7,610 | 9,390 | 16,539 | 15,344 | 12,570 | |
| 3 | Hyundai | Santa Fe | 10,588 | 13,390 | 14,492 | 15,937 | 11,728 | |
| 4 | Toyota | Land Cruiser | 5,444 | 6,258 | 6,052 | 6,286 | 5,237 | |
| 5 | Mitsubishi | Pajero/Montero/Shogun | 3,444 | 4,859 | 5,920 | 5,590 | 4,417 | |
| 6 | SsangYong | Rexton | 1,175 | 1,929 | 2,214 | 2,187 | 2,610 | |
| 7 | Mazda | CX-9 | — | 70 | 1,057 | 153 | 23 | |
| Total | — | — | — | — | — | 54,783 | 52,669 |
See also
- Car classifications
- Crossover (automobile)
- Off-road vehicle
- Sport utility vehicle
References
- "REGULATION (EEC) No 4064/89 - MERGER PROCEDURE" (PDF). ec.europa.eu. Luxemburg: Office for Official Publications of the European Communities: 2. 17 March 1999. Retrieved 2019-03-03.
- "Car prices within the European Union / Prix des voitures au sein de l'Union européenne / Autopreise in der europäischen Union" (PDF). ec.europa.eu (in English, French, and German). Brussels: Publications Office of the European Union. 1 January 2011. Retrieved 2019-03-03.
- "Impact on the Competitiveness of the European Automotive Industry of Potential FTA with India and ASEAN" (PDF). www.europa.eu. p. 8. Archived from the original (PDF) on 29 April 2013.
- "Car Classes Simplified: The Euro-standard Car Segments". www.autoIndustriya.com. 9 March 2016. Retrieved 24 April 2019.
- "European sales 2017 small crossover segment". www.carsalesbase.com. 15 February 2018.
- "European sales 2017 compact & midsized crossover segments". www.carsalesbase.com. 16 February 2018.
- "European sales 2017 large SUV segment". www.carsalesbase.com. 16 February 2018.