Halayib
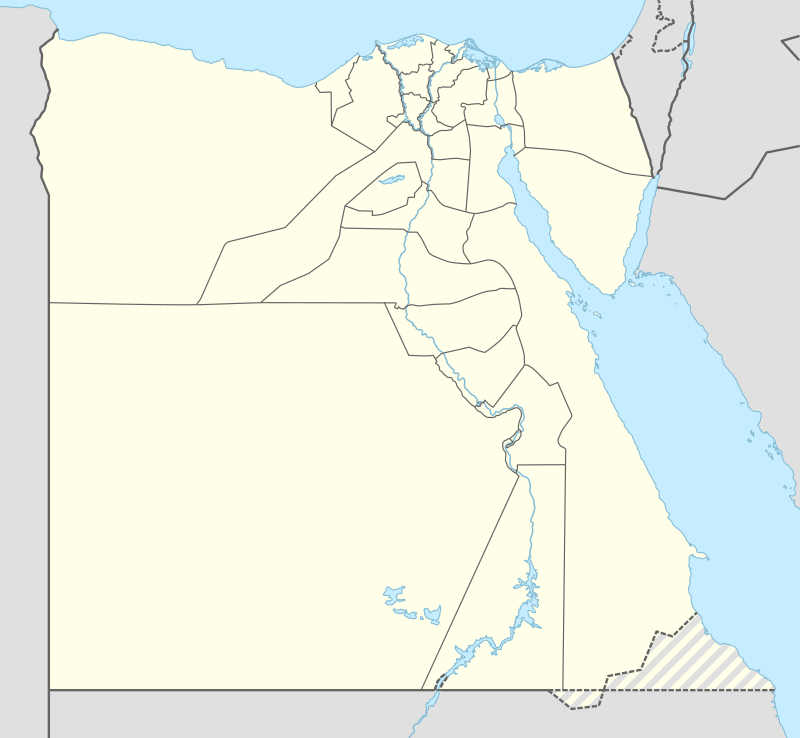
Halayib (Arabic: حلايب, romanized: Ḥalāyib, often written Halayeb and sometimes Hala'ib), is a Red Sea port and town, located in the Halayib Triangle, a 20,580 km2 (7,950 sq mi) area disputed between Egypt and Sudan. The town lies on the southern tip of what Egyptians refer to as the Red Sea Riviera and the north eastern corner of Sudan's Red Sea State and is near the ruins of medieval ‘Aydhab. De facto control of the area is held by the Egyptian government.
Halayib حلايب | |
|---|---|
 Halayib Halayib (Egypt)  Halayib Halayib (Sudan) | |
| Coordinates: 22°13′23″N 36°38′51″E | |
| Country | de jure disputed area between de facto |
| Governorate | Red Sea Governorate |
| State | Red Sea State |
| • Summer (DST) | 02 |
Ecology and geography
In the Halayib region, Afrotropical elements have their northern limits at Gabal Elba, making it a unique region among the regions dominating North African ecosystems. There is also dense cover of acacias, mangroves and other shrubs, in addition to endemic species of plants such as Biscutella elbensis.
The highest peaks in the area are Mount Elba (1,435 m or 4,708 ft), Mount Shellal (1,409 m or 4,623 ft), Mount Shendib (1,911 m or 6,270 ft) and Mount Shendodai (1,526 m or 5,007 ft).
Climate
| Climate data for Halayib (1961–1990) | |||||||||||||
|---|---|---|---|---|---|---|---|---|---|---|---|---|---|
| Month | Jan | Feb | Mar | Apr | May | Jun | Jul | Aug | Sep | Oct | Nov | Dec | Year |
| Record high °C (°F) | 31.4 (88.5) |
40.7 (105.3) |
29.7 (85.5) |
42.8 (109.0) |
46.6 (115.9) |
45.4 (113.7) |
44.5 (112.1) |
44.5 (112.1) |
45.0 (113.0) |
40.0 (104.0) |
35.4 (95.7) |
34.0 (93.2) |
46.6 (115.9) |
| Average high °C (°F) | 24.9 (76.8) |
25.7 (78.3) |
27.5 (81.5) |
30.6 (87.1) |
31.1 (88.0) |
35.7 (96.3) |
37.0 (98.6) |
37.1 (98.8) |
33.7 (92.7) |
32.4 (90.3) |
27.7 (81.9) |
24.9 (76.8) |
30.7 (87.3) |
| Daily mean °C (°F) | 20.9 (69.6) |
21.1 (70.0) |
22.7 (72.9) |
25.5 (77.9) |
27.3 (81.1) |
30.5 (86.9) |
31.5 (88.7) |
31.9 (89.4) |
29.4 (84.9) |
28.1 (82.6) |
24.1 (75.4) |
21.3 (70.3) |
26.2 (79.2) |
| Average low °C (°F) | 16.8 (62.2) |
16.5 (61.7) |
18.0 (64.4) |
20.5 (68.9) |
23.4 (74.1) |
25.3 (77.5) |
26.1 (79.0) |
26.7 (80.1) |
25.1 (77.2) |
23.8 (74.8) |
20.5 (68.9) |
17.6 (63.7) |
21.7 (71.1) |
| Record low °C (°F) | 11.0 (51.8) |
10.3 (50.5) |
12.0 (53.6) |
13.5 (56.3) |
16.2 (61.2) |
18.0 (64.4) |
16.5 (61.7) |
19.7 (67.5) |
20.5 (68.9) |
18.8 (65.8) |
15.5 (59.9) |
12.0 (53.6) |
10.3 (50.5) |
| Average precipitation mm (inches) | 0.6 (0.02) |
0.0 (0.0) |
0.0 (0.0) |
0.5 (0.02) |
1.2 (0.05) |
0.0 (0.0) |
0.2 (0.01) |
0.0 (0.0) |
0.0 (0.0) |
3.2 (0.13) |
17.9 (0.70) |
4.2 (0.17) |
27.8 (1.09) |
| Average precipitation days (≥ 0.1 mm) | 0.1 | 0.0 | 0.0 | 0.1 | 0.1 | 0.0 | 0.1 | 0.0 | 0.0 | 0.2 | 1.4 | 0.7 | 2.7 |
| Average relative humidity (%) | 72 | 69 | 69 | 69 | 63 | 56 | 56 | 61 | 63 | 75 | 76 | 72 | 66.8 |
| Source: NOAA[1] | |||||||||||||
See also
References
- Notes
- "Halaib Climate Normals 1961–1990". National Oceanic and Atmospheric Administration. Retrieved January 18, 2016.
| 1,000,000 and more | |
|---|---|
| 300,000–999,999 | |
| 100,000–299,999 | |
| <99,999 | |