Guinsiliban
Guinsiliban, officially the Municipality of Guinsiliban, is a 6th class municipality in the province of Camiguin, Philippines. According to the 2015 census, it has a population of 6,281 people.[4]
Guinsiliban | |
|---|---|
| Municipality of Guinsiliban | |
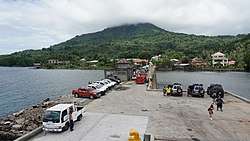 Guinsiliban Port | |
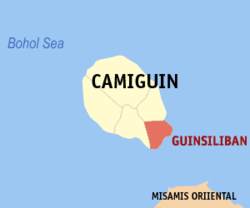 Map of Camiguin with Guinsiliban highlighted | |
OpenStreetMap 
| |
.svg.png) Guinsiliban Location within the Philippines | |
| Coordinates: 9°06′N 124°47′E | |
| Country | |
| Region | Northern Mindanao (Region X) |
| Province | Camiguin |
| District | Lone District |
| Founded | June 13, 1950 |
| Barangays | 7 (see Barangays) |
| Government | |
| • Type | Sangguniang Bayan |
| • Mayor | Helenio N. Abecia |
| • Vice Mayor | Elvis O. Roxas |
| • Congressman | Xavier Jesus D. Romualdo |
| • Electorate | 5,684 voters (2019) |
| Area | |
| • Total | 18.52 km2 (7.15 sq mi) |
| Elevation | 5.9 m (19.4 ft) |
| Population (2015 census)[4] | |
| • Total | 6,281 |
| • Density | 340/km2 (880/sq mi) |
| • Households | 1,452 |
| Economy | |
| • Income class | 6th municipal income class |
| • Poverty incidence | 61.04% (2015)[5] |
| • Revenue (₱) | 35,995,360.46 (2016) |
| Time zone | UTC+8 (PST) |
| ZIP code | 9102 |
| PSGC | |
| IDD : area code | +63 (0)88 |
| Climate type | tropical rainforest climate |
| Native languages | Kinamigin language Cebuano Tagalog |
| Website | www |
Barangays
Guinsiliban is politically subdivided into 7 barangays.
- Butay
- Cabuan
- Cantaan
- Liong
- Maac
- North Poblacion
- South Poblacion
Climate
| Climate data for Guinsiliban, Camiguin | |||||||||||||
|---|---|---|---|---|---|---|---|---|---|---|---|---|---|
| Month | Jan | Feb | Mar | Apr | May | Jun | Jul | Aug | Sep | Oct | Nov | Dec | Year |
| Average high °C (°F) | 28 (82) |
28 (82) |
29 (84) |
30 (86) |
30 (86) |
29 (84) |
29 (84) |
30 (86) |
30 (86) |
29 (84) |
29 (84) |
28 (82) |
29 (84) |
| Average low °C (°F) | 23 (73) |
23 (73) |
23 (73) |
23 (73) |
24 (75) |
25 (77) |
25 (77) |
25 (77) |
25 (77) |
25 (77) |
24 (75) |
24 (75) |
24 (75) |
| Average precipitation mm (inches) | 327 (12.9) |
254 (10.0) |
185 (7.3) |
128 (5.0) |
215 (8.5) |
273 (10.7) |
248 (9.8) |
243 (9.6) |
214 (8.4) |
246 (9.7) |
271 (10.7) |
271 (10.7) |
2,875 (113.3) |
| Average rainy days | 24.3 | 21.1 | 22.5 | 20.6 | 28.3 | 28.8 | 29.4 | 29.0 | 28.0 | 28.3 | 26.0 | 24.2 | 310.5 |
| Source: Meteoblue [6] | |||||||||||||
Demographics
| Population census of Guinsiliban | ||
|---|---|---|
| Year | Pop. | ±% p.a. |
| 1960 | 3,499 | — |
| 1970 | 5,686 | +4.97% |
| 1975 | 4,057 | −6.55% |
| 1980 | 4,254 | +0.95% |
| 1990 | 4,341 | +0.20% |
| 1995 | 4,919 | +2.37% |
| 2000 | 5,092 | +0.74% |
| 2007 | 5,559 | +1.22% |
| Source: Philippine Statistics Authority[4][7][8][9] | ||
In the 2015 census, the population of Guinsiliban was 6,281 people,[4] with a density of 340 inhabitants per square kilometre or 880 inhabitants per square mile.
References
- "Municipality". Quezon City, Philippines: Department of the Interior and Local Government. Retrieved 31 May 2013.
- "Province: Camiguin". PSGC Interactive. Quezon City, Philippines: Philippine Statistics Authority. Retrieved 12 November 2016.
- "Guinsiliban, Camiguin Profile". PhilAtlas.com. Retrieved 15 June 2020.
- Census of Population (2015). "Region X (Northern Mindanao)". Total Population by Province, City, Municipality and Barangay. PSA. Retrieved 20 June 2016.
- "PSA releases the 2015 Municipal and City Level Poverty Estimates". Quezon City, Philippines. Retrieved 12 October 2019.
- "Guinsiliban: Average Temperatures and Rainfall". Meteoblue. Retrieved 4 March 2020.
- Census of Population and Housing (2010). "Region X (Northern Mindanao)". Total Population by Province, City, Municipality and Barangay. NSO. Retrieved 29 June 2016.
- Censuses of Population (1903–2007). "Region X (Northern Mindanao)". Table 1. Population Enumerated in Various Censuses by Province/Highly Urbanized City: 1903 to 2007. NSO.
- "Province of Camiguin". Municipality Population Data. Local Water Utilities Administration Research Division. Retrieved 17 December 2016.
External links
- Guinsiliban Profile at PhilAtlas.com
- Philippine Standard Geographic Code
- Philippine Census Information
Places adjacent to Guinsiliban | ||||||||||
|---|---|---|---|---|---|---|---|---|---|---|
| ||||||||||
Mambajao (capital) | |
| Municipalities | |
This article is issued from Wikipedia. The text is licensed under Creative Commons - Attribution - Sharealike. Additional terms may apply for the media files.