Government spending in the United Kingdom
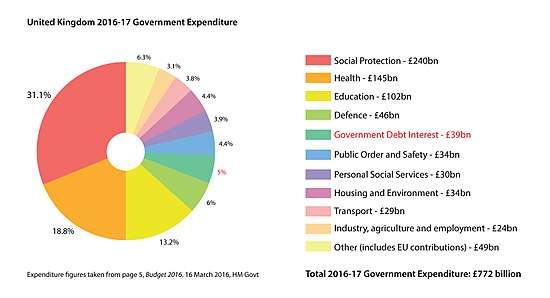
Central government spending in the United Kingdom, also called public expenditure, is the responsibility of the UK government, the Scottish Government, the Welsh Government and the Northern Ireland Executive. In the budget for financial year 2016–17 , proposed total government spending was £772 billion.[1]
Spending per head is significantly higher in Northern Ireland, Wales and Scotland than it is in England.[2]
Scotland has historically collected more tax per person than has the rest of the UK, although following a decline in the oil price in 2014, Scotland produced slightly less revenue than England per capita in 2014–15.[3][4] As of 2014 and the release of the GERS report, Scotland had a higher deficit relative to the UK deficit as a whole and received an increased net subsidy from UK government borrowing, this deficit was attributed to declining oil revenues as the price of crude oil has fallen. This condition is predicted to only get worse should oil revenues fall further.[5][6]
| Department | 2016–17 Expenditure (£bn)[1] |
|---|---|
| Social protection | 240 |
| Health | 145 |
| Education | 102 |
| Debt interest | 39 |
| Defence | 46 |
| Public order and safety | 34 |
| Personal social services | 30 |
| Housing and environment | 34 |
| Transport | 29 |
| Industry, agriculture and employment | 24 |
| Other | 49 |
| Total Government spending | 772 |
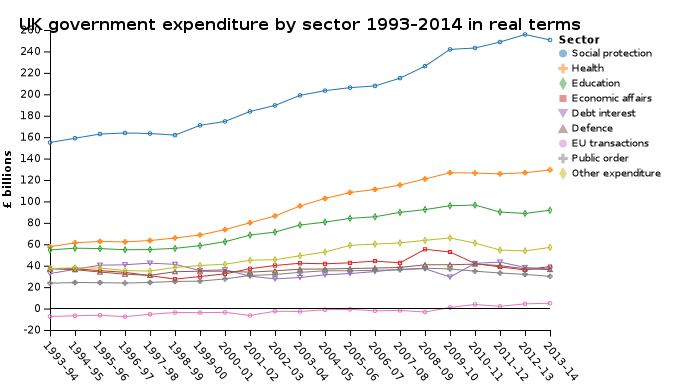
The graph shows spending by sector with prices adjusted for inflation. ‘Other expenditure’ includes general public services (£22bn in 2013/14), housing and community amenities (£12bn), environment protection (£12bn), recreation, culture and religion (£12bn). Accounting adjustments of £46 in 2013/14 have not been included. The spikes in 'economic affairs' and 'debt interest' were due to the financial sector interventions in the banking collapse of 2008.[7]
Local government spending
Local government spending is the responsibility of local authorities, under the supervision of the respective national governments:
- English local authorities, under the supervision of the Secretary of State for Communities and Local Government
- Scottish local authorities, under the supervision of the Cabinet Secretary for Finance, Employment and Sustainable Growth
- Welsh local authorities, under the supervision of the Minister for Housing and Local Government
- Northern Ireland local authorities, under the supervision of the Minister of the Environment
See also
- Barnett Formula
- Fiscal autonomy for Scotland
- History of the English fiscal system
- Taxation in the United Kingdom
- United Kingdom budget, the budget of the UK government
- United Kingdom national debt
- By region
International:
- Government budget by country
- List of countries by tax revenue as percentage of GDP
References
- "UK 2016 Budget" (PDF). p. 5.
- Daily Telegraph (30 August 2011). "Government spending gap between England and Scotland widens". The Daily Telegraph. London. Retrieved 30 August 2011.
- Scottish Government. "Scotland generates more in tax than rest of the UK". Retrieved 9 October 2013.
- "A disaggregation of HMRC tax receipts between England, Wales, Scotland & Northern Ireland" (PDF). 1 October 2015. p. 12. Retrieved 28 December 2015.
- "Government Expenditure & Revenue Scotland 2012–13".
- http://www.gov.scot/Resource/0047/00472877.pdf#page=8
- HM Treasury (30 April 2015). "Public Spending Statistics release: April 2015". gov.uk. p. 21. Retrieved 26 June 2015.
United Kingdom budget | |
|---|---|
| By year | |
| Other | |