Geography of New York City
The geography of New York City is characterized by its coastal position at the meeting of the Hudson River and the Atlantic Ocean in a naturally sheltered harbor. The city's geography, with its scarce availability of land, is a contributing factor in making New York the most densely populated major city in the United States. Environmental issues are chiefly concerned with managing this density, which also explains why New York is among the most energy-efficient and least automobile-dependent cities in the United States. The city's climate is temperate.
Geography

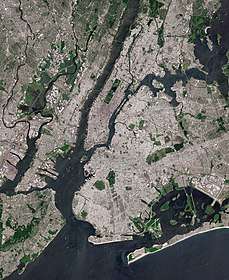
New York City is located on the coast of the Northeastern United States at the mouth of the Hudson River in southeastern New York state. It is located in the New York–New Jersey Harbor Estuary, the centerpiece of which is the New York Harbor, whose deep waters and sheltered bays helped the city grow in significance as a trading city. Much of New York is built on the three islands of Manhattan, Staten Island, and western Long Island, making land scarce and encouraging a high population density.
The Hudson River flows from the Hudson Valley into New York Bay, becoming a tidal estuary that separates the Bronx and Manhattan from Northern New Jersey. The Harlem River, another tidal strait between the East and Hudson Rivers, separates Manhattan from the Bronx.
The boroughs of New York City straddle the border between two geologic provinces of eastern North America. Brooklyn and Queens, located on Long Island, are part of the eastern coastal plain. Long Island is a massive moraine which formed at the southern fringe of the Laurentide Ice Sheet during the last Ice Age. The Bronx and Manhattan lie on the eastern edge of the Newark Basin, a block of the Earth's crust which sank downward during the disintegration of the supercontinent Pangaea during the Triassic period. The Palisades Sill on the New Jersey shore of the Hudson River exposes ancient, once-molten rock that filled the basin. Tough metamorphic rocks underlie much of Manhattan, providing solid support for its many skyscrapers.
The city's land has been altered considerably by human intervention, with substantial land reclamation along the waterfronts since Dutch colonial times. Reclamation is most notable in Lower Manhattan with modern developments like Battery Park City. Much of the natural variations in topography have been evened out, particularly in Manhattan.[1] The West Side of Manhattan retains some hilliness, especially in Upper Manhattan, while the East Side has been considerably flattened. Duffy's Hill in East Harlem is one notable exception to the East Side's relatively level grade.
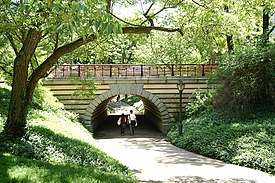
The city's land area is estimated to be 321 square miles (830 km2).[2] However, a more recent estimate calculates a total land area of 304.8 square miles (789.4 square kilometres).[3] The highest natural point in the city is Todt Hill on Staten Island, which at 409.8 ft (124.9 m) above sea level is the highest hill on the Eastern Seaboard south of Maine. The summit of the ridge is largely covered in woodlands as part of the Staten Island Greenbelt.
Adjacent counties
Boroughs
New York City comprises five boroughs, an unusual form of government used to administer the five constituent counties that make up the city. Throughout the boroughs there are hundreds of distinct neighborhoods, many with a definable history and character all their own. If the boroughs were each independent cities, four of the boroughs (Brooklyn, Queens, Manhattan, and the Bronx) would be among the ten most populous cities in the United States.
- The Bronx (Bronx County, pop. 1,364,566)[4] is New York City's northernmost borough. It is the birthplace of rap and hip hop culture,[5] the site of Yankee Stadium, and home to the largest cooperatively owned housing complex in the United States, Co-op City.[6] Except for a small piece of Manhattan known as Marble Hill, the Bronx is the only section of the city that is part of the North American mainland.
- Brooklyn (Kings County, pop. 2,511,408)[4] is the city's most populous borough and was an independent city until 1898. Brooklyn is known for its cultural diversity, an independent art scene, distinct neighborhoods and a unique architectural heritage. The borough also features a long beachfront and Coney Island, famous as one of the earliest amusement grounds in the country.
- Manhattan (New York County, pop. 1,606,275)[4] is the most densely populated borough and home to most of the city's skyscrapers. The borough contains the major business centers of the city and many cultural attractions. Manhattan is loosely divided into downtown, midtown, and uptown regions.
- Queens (Queens County, pop. 2,256,576)[4] is geographically the largest borough and the most ethnically diverse county in the United States.[7] Historically a collection of small towns and villages founded by the Dutch, the borough today is mainly residential and middle class, with enclaves of above average income and wealth. It is the only large county in the United States where the median income among African-American households, about $52,000 a year, has surpassed that of Caucasian households.[8] Queens is the site of Citi Field and its predecessor Shea Stadium, the home of the New York Mets, and annually hosts the US Tennis Open.
- Staten Island (Richmond County, pop. 475,014)[4] is the most suburban in character of the five boroughs. It is connected to Brooklyn by the Verrazano-Narrows Bridge and to Manhattan by the free Staten Island Ferry. Until 2001 the borough was home to the Fresh Kills Landfill, formerly the largest landfill in the world, which is now being reconstructed as Freshkills Park, one of the largest urban parks in the United States.
Climate
| New York | ||||||||||||||||||||||||||||||||||||||||||||||||||||||||||||
|---|---|---|---|---|---|---|---|---|---|---|---|---|---|---|---|---|---|---|---|---|---|---|---|---|---|---|---|---|---|---|---|---|---|---|---|---|---|---|---|---|---|---|---|---|---|---|---|---|---|---|---|---|---|---|---|---|---|---|---|---|
| Climate chart (explanation) | ||||||||||||||||||||||||||||||||||||||||||||||||||||||||||||
| ||||||||||||||||||||||||||||||||||||||||||||||||||||||||||||
| ||||||||||||||||||||||||||||||||||||||||||||||||||||||||||||

Although it is not in the subtropics and its winters are cold, New York has a humid subtropical climate according to the Köppen climate classification because the coldest months' average temperatures are not low enough for persistent snow cover, between 32.5 and 33.0 °F (0.3 and 0.6 °C) at all three major reporting stations within the city. The region's climate is vastly affected by its proximity to the Atlantic Ocean. New York City's climate patterns are affected by the Atlantic multidecadal oscillation, a 70-year-long warming and cooling cycle in the Atlantic that influences the frequency and severity of hurricanes and coastal storms.[9] Unless otherwise stated, all figures below are cited from the Central Park station.
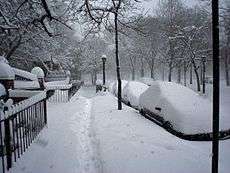
- Winters are typically cold. During the typical winter, there are 17 days where the temperature fails to rise above 32 °F (0 °C).[10] Although there is an average 2.7 nights with a low at or below 10 °F (−12 °C),[11] and the city is located in USDA Hardiness Zone 7,[12] indicating the coldest temperature of the year is typically in the 0 to 10 °F (−18 to −12 °C) range, temperatures reaching 0 °F (−18 °C) are very uncommon, with the most recent occurrence being on February 14, 2016.[10] New York winters sometimes feature several nor'easters that can paralyze the city with over a foot (30 cm) of snow. However, variation in the climate also occasionally renders winter mild and almost snowless.
- Springs are mild, with high temperatures averaging in the 50s °F (10 to 15 °C) in late March to the lower 80s °F (26–28 °C) in early June. The weather is unpredictable and can even bring relatively cool summers (such as in 1992) as an occasional surprise, and snowstorms arriving as late as the second week in April (significant snow after mid-March is fairly rare though). Thunderstorms are common in spring.
- Summers in New York are warm and humid, with temperatures reaching 90 °F (32 °C) or higher on an average of 17 days per year (with the average window for such readings being May 27 thru August 24),[10] although high temperatures above 100 °F (38 °C) are rare, having last been seen July 18, 2012.[10] Humidity levels are usually quite high in July and August. Thunderstorms are common in summer, and produce even the occasional tornado,[13] although severe weather is more common west of the city in New Jersey because the city's proximity to the ocean usually greatly weakens severe thunderstorms before they hit the city. Hurricanes are considered to be a major threat to the area (and especially the Long Island suburbs). While infrequent, a direct hit could cause large loss of life and enormous property damage due to the high population in coastal areas, as proven by Hurricane Sandy in October 2012.
- Autumns are comfortable in New York and similar to spring in temperature. However, the weather is notably unpredictable and travelers are advised to check forecasts and bring several layers of clothing in late fall and in the early spring months (e.g. November, March, April) as temperatures do fluctuate quickly at these times of year.
- Precipitation is plentiful and averages at 49.9 in (1,267 mm) annually, with spring being the wettest season and February the driest month. However, the wettest year on record at Central Park, 1983, with 80.56 in (2,046 mm) of precipitation, as well as five other of the top 10 wettest years, occurred during the current 1981–2010 normal period; for all months except December, the median monthly precipitation is less than the official monthly normal precipitation. The driest year was 1965 with 26.09 in (663 mm) of precipitation. Monthly precipitation has ranged from 0.02 in (0.5 mm) in June 1949 to 18.95 in (481 mm) in August 2011.[14] New York can have excessive days of rain or long stretches of dry weather. The most rainfall in 24 hours was 8.28 in (210.3 mm) on September 23, 1882.
- Snow averages at 25.8 in (65.5 cm) per season, but this figure increases rapidly in the suburbs to the north and west and decreases slightly towards the Long Island suburbs. The most snow in one calendar day was 27.3 in (69 cm) on January 23, 2016,[10] part of the city's heaviest fall in a single storm at 27.5 in (70 cm) on January 22–23, 2016.[15] With monthly snow records dating back to 1869, the most snow in a single month was 36.9 in (94 cm) in February 2010, and the snowiest season is, by far, 1995–96 with 75.6 in (192 cm). The least snowy season was 1972–73 with 2.8 in (7.1 cm). The window for measurable (≥0.1 in or 0.25 cm) snow is on average December 15 thru March 17; March snow occurs in the majority of seasons while April or November snow is typically only seen at most several times per decade. Nothing more than trace amounts has fallen in May, while several decades may pass between measurable snow events in October.[16]
- Temperature records have been set as high as 106 °F (41 °C) on July 9, 1936 (in Central Park; LaGuardia Airport recorded a 107 °F or 42 °C reading on July 3, 1966) and as low as −15 °F (−26 °C) on February 9, 1934, although a colder temperature of −16 °F (−27 °C) was recorded before official records began, on January 23, 1780,[17][18][19] and again an even colder temperature of −17 °F (−27 °C) was recorded on December 16, 1835.[20][21][22][23][24] The record high daily minimum temperature was 84 °F (29 °C), most recently on July 22, 2011 (although LaGuardia Airport recorded a daily low of 86 °F or 30 °C as recently as July 19, 2013), while the record low daily maximum temperature was 2 °F (−17 °C) on December 30, 1917.[10] Over the course of a year, New York City averages 70 days with lows at or below freezing; the average window for freezing temperatures is November 20 through March 29, allowing a growing season of 235 days.[10]
| Monthly and annual statistics for the three main climatology stations in the city | ||||||||||||||||||||||||||||||||||||||||||||||||||||||||||||||||||||||||||||||||||||||||||||||||||||||||||||||||||||||||||||||||||||||||||||||||||||||||||||||||||||||||||||||||||||||||||||||||||||||||||||||||||||||||||||||||||||||||||||||||||||||||||||||||||||||||||||||||||||||||||||||||||||||||||||||||||||||||||||||||||||||||||||||||||||||||||||||||||||||||||||||||||||||||||||||||||||||||
|---|---|---|---|---|---|---|---|---|---|---|---|---|---|---|---|---|---|---|---|---|---|---|---|---|---|---|---|---|---|---|---|---|---|---|---|---|---|---|---|---|---|---|---|---|---|---|---|---|---|---|---|---|---|---|---|---|---|---|---|---|---|---|---|---|---|---|---|---|---|---|---|---|---|---|---|---|---|---|---|---|---|---|---|---|---|---|---|---|---|---|---|---|---|---|---|---|---|---|---|---|---|---|---|---|---|---|---|---|---|---|---|---|---|---|---|---|---|---|---|---|---|---|---|---|---|---|---|---|---|---|---|---|---|---|---|---|---|---|---|---|---|---|---|---|---|---|---|---|---|---|---|---|---|---|---|---|---|---|---|---|---|---|---|---|---|---|---|---|---|---|---|---|---|---|---|---|---|---|---|---|---|---|---|---|---|---|---|---|---|---|---|---|---|---|---|---|---|---|---|---|---|---|---|---|---|---|---|---|---|---|---|---|---|---|---|---|---|---|---|---|---|---|---|---|---|---|---|---|---|---|---|---|---|---|---|---|---|---|---|---|---|---|---|---|---|---|---|---|---|---|---|---|---|---|---|---|---|---|---|---|---|---|---|---|---|---|---|---|---|---|---|---|---|---|---|---|---|---|---|---|---|---|---|---|---|---|---|---|---|---|---|---|---|---|---|---|---|---|---|---|---|---|---|---|---|---|---|---|---|---|---|---|---|---|---|---|---|---|---|---|---|---|---|---|---|---|---|---|---|---|---|---|---|---|---|---|---|---|---|---|---|---|---|---|---|---|---|---|---|---|---|---|---|---|---|---|---|---|---|---|---|---|---|---|---|---|---|---|---|---|---|---|---|---|---|---|---|---|---|---|---|---|---|---|---|---|---|---|---|---|---|---|
| ||||||||||||||||||||||||||||||||||||||||||||||||||||||||||||||||||||||||||||||||||||||||||||||||||||||||||||||||||||||||||||||||||||||||||||||||||||||||||||||||||||||||||||||||||||||||||||||||||||||||||||||||||||||||||||||||||||||||||||||||||||||||||||||||||||||||||||||||||||||||||||||||||||||||||||||||||||||||||||||||||||||||||||||||||||||||||||||||||||||||||||||||||||||||||||||||||||||||
| ||||||||||||||||||||||||||||||||||||||||||||||||||||||||||||||||||||||||||||||||||||||||||||||||||||||||||||||||||||||||||||||||||||||||||||||||||||||||||||||||||||||||||||||||||||||||||||||||||||||||||||||||||||||||||||||||||||||||||||||||||||||||||||||||||||||||||||||||||||||||||||||||||||||||||||||||||||||||||||||||||||||||||||||||||||||||||||||||||||||||||||||||||||||||||||||||||||||||
- Time series plot for Central Park, 1869–present
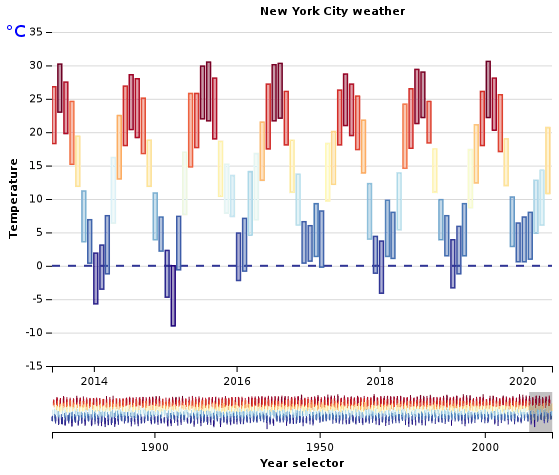
See or edit raw graph data.
Environmental issues
New York City plays an important role in the green policy agenda because of its size. Environmental groups make large efforts to help shape legislation in New York because they see the strategy as an efficient way to influence national programs. New York City's economy is larger than Switzerland's, a size that means the city has potential to set new de facto standards. Manufacturers are also attuned to the latest trends and needs in the city because the market is simply too big to ignore.
Although cities like San Francisco or Portland, Oregon are most commonly associated with urban environmentalism in the United States, New York City's unique urban footprint and extensive transportation systems make it more sustainable than most American cities.
Maps and satellite images
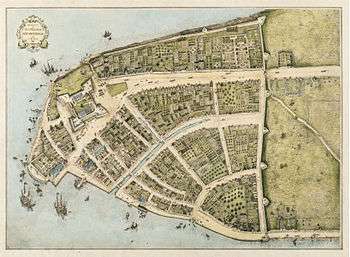 New Amsterdam in 1660
 One of the 1770 Ratzer Maps
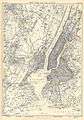 New York City and the city of Brooklyn, in 1885
 New York City area in 1906
 Downtown New York City in 1910
 False-color satellite image
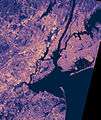 Thermal image (blue is warm, yellow is hot)
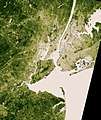 Vegetation is beige (sparse) and deep green (dense)
 Satellite photograph of southern Manhattan taken in 2002
See also
References
Notes
- Mean monthly maxima and minima (i.e. the expected highest and lowest temperature readings at any point during the year or given month) calculated based on data at said location from 1981 to 2010.
- Official weather observations for Central Park were conducted at the Arsenal at Fifth Avenue and 64th Street from 1869 to 1919, and at Belvedere Castle since 1919.[25]
- Mean monthly maxima and minima (i.e. the expected highest and lowest temperature readings at any point during the year or given month) calculated based on data at said location from 1981 to 2010.
Sources
- Lopate, Phillip (2004). Waterfront: A Walk Around Manhattan. Anchor Press. ISBN 0-385-49714-8.
- "Land Use Facts". New York City Department of City Planning. Archived from the original on 2007-03-30. Retrieved 2007-03-13.
- Roberts, Sam (2008-05-22). "It's Still a Big City, Just Not Quite So Big". The New York Times. Retrieved 2008-05-22.
- "New York State Department of Labor - Population Estimates". Archived from the original on 2007-01-04. Retrieved 2006-11-02.
- Toop, David (1992). Rap Attack 2: African Rap to Global Hip-Hop. Serpents Tail. ISBN 1-85242-243-2.
- Frazier, Ian (2006-06-26). "Utopia, the Bronx". The New Yorker. Retrieved 2007-03-26.
- O'Donnell, Michelle (2006-07-04). "In Queens, It's the Glorious 4th, and 6th, and 16th, and 25th..." New York Times. Retrieved 2006-07-19.
- Roberts, Sam (2006-01-10). "Black Incomes Surpass Whites in Queens". The New York Times. Retrieved 2007-03-28.
- Riley, Mary Elizabeth (2006). "Assessing the Impact of Interannual Climate Variability on New York City's Reservoir System". Cornell University Graduate School for Atmospheric Science. hdl:1813/2623. Cite journal requires
|journal=(help) - "NowData - NOAA Online Weather Data". National Oceanic and Atmospheric Administration. Retrieved 2018-04-10.
- "Station Name: NY NEW YORK CNTRL PK TWR". National Oceanic and Atmospheric Administration. Retrieved 2018-04-10.
- "Hardiness Zones". Arbor Day Foundation. 2006. Retrieved 2008-11-04.
- CNN Wire Staff (2010-09-17). "2 tornadoes and microburst touch down in New York City". CNN. CNN. Retrieved 2010-09-18.
- "Record Wet and Dry Years and Months at CPK". NWS Upton, New York. Retrieved 2014-03-29.
- "Biggest Snowstorms (One Foot or More) at Central Park (1869 to Present)" (PDF). NWS Upton, New York. Retrieved 2016-01-24.
- "Monthly & Seasonal Snowfall at Central Park". National Oceanic and Atmospheric Administration. Retrieved 2013-06-07.
- https://www.weatherforyou.com/weather_history/cday.php?m=1&d=29
- http://www.islandnet.com/~see/weather//almanac/diaryjan.htm
- https://greenerpasture.com/Places/ShowNews/38670
- https://nypost.com/2004/12/02/the-great-fire-of-1835/
- https://theculturetrip.com/north-america/usa/new-york/articles/art-history-and-new-york-citys-great-fire-of-1835/
- https://www.weatherconcierge.com/fire-and-ice-proved-to-be-a-deadly-and-destructive-combination-in-new-york-city/
- http://www.artnet.com/magazineus/reviews/karlins/karlins12-4-08.asp
- "Archived copy". Archived from the original on 2019-03-06. Retrieved 2019-03-05.CS1 maint: archived copy as title (link)
- Belvedere Castle at NYC Parks
- "New York Central Park, NY Climate Normals 1961−1990". NOAA.
- "Average Percent Sunshine through 2009". National Climatic Data Center. Retrieved 2012-11-14.
- "New York, New York, USA - Monthly weather forecast and Climate data". Weather Atlas. Retrieved 4 July 2019.
- "NowData - NOAA Online Weather Data". National Oceanic and Atmospheric Administration. Retrieved 2019-10-03.
- "Station Name: NY NEW YORK LAGUARDIA AP". National Oceanic and Atmospheric Administration. Retrieved 2016-09-11.
- "NEW YORK/LAGUARDIA ARPT NY Climate Normals 1961−1990". NOAA. Retrieved 2014-03-23.
- "Station Name: NY NEW YORK JFK INTL AP". National Oceanic and Atmospheric Administration. Retrieved 2016-09-11.
- "NEW YORK/JFK, NY Climate Normals 1961−1990". NOAA. Retrieved 2014-03-23.
Further reading
- The Vegan Guide to New York City, by Rynn Berry and Chris A. Suzuki
- The Big Green Apple: Your Guide to Eco-Friendly Living in New York City, by Mathieu Fontaine
- John H. Betts The Minerals of New York City originally published in Rocks & Minerals magazine, Volume 84, No . 3 pages 204-252 (2009).
External links
- Green Apple Map - Interactive green map of New York City's environmental resources.
- NYC Open Accessible Space Information System - Interactive mapping resource of open space in New York City.
- Council on the Environment of New York City (CENYC) - Privately funded citizens' organization in the Office of the Mayor of New York City.
- NYCityMap - New York City Government interactive map
| Major islands | 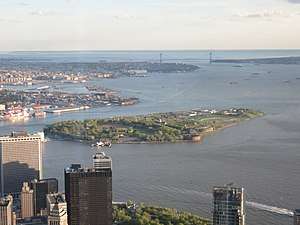 | |
|---|---|---|
| Pelham Islands | ||
| New York Bay | ||
| Jamaica Bay | ||
| East River | ||
| Other | ||
Former islands shown in italics | ||
| By topic |  | |
|---|---|---|
| Boroughs |
| |
| Government |
| |
| Emergency services | ||
| Transportation | ||
| Culture | ||
| Education | ||
| ||