Electoral district of Mulgrave (Queensland)
Mulgrave is an electoral district of the Legislative Assembly in the Australian state of Queensland.
| Mulgrave Queensland—Legislative Assembly | |||||||||||||||
|---|---|---|---|---|---|---|---|---|---|---|---|---|---|---|---|
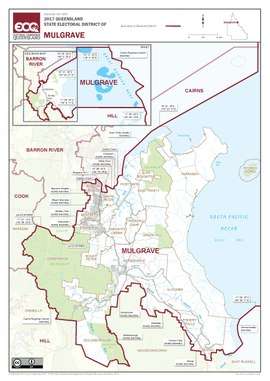 Electoral map of Mulgrave 2017 | |||||||||||||||
| State | Queensland | ||||||||||||||
| Dates current | 1873–1888; 1950–present | ||||||||||||||
| MP | Curtis Pitt | ||||||||||||||
| Party | Labor | ||||||||||||||
| Namesake | Mulgrave River | ||||||||||||||
| Electors | 33,446 (2017) | ||||||||||||||
| Area | 2,923 km2 (1,128.6 sq mi) | ||||||||||||||
| Coordinates | 17°13′S 145°51′E | ||||||||||||||
| |||||||||||||||
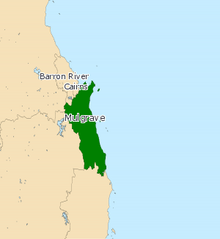
Electoral map of Mulgrave 2008
The district in its present form is a narrow coastal strip running from the southern suburbs of Cairns at its northern end to Innisfail at its southern end. Mulgrave also includes the towns of Gordonvale and Babinda. The electorate was first created for the 1950 election.
There was an earlier district also called Mulgrave that existed from 1873 to 1888. It was based on the town of Bundaberg and was replaced by the new electoral district of Bundaberg by the Electoral Districts Act of 1887.[1]
In 2017 a chunk of the electoral district split from Mulgrave, this area includes Innisfail, Tully and Babinda districts.
Members for Mulgrave
| First incarnation (1873–1888) | |||
|---|---|---|---|
| Member | Party | Term | |
| Walter Scott | Squatter conservative | 1873–1878 | |
| Thomas McIlwraith | Conservative leader | 1878–1886 | |
| Walter Adams | Unaligned | 1886–1888 | |
| Second incarnation (1950–present) | |||
| Member | Party | Term | |
| Bob Watson | Country | 1950–1953 | |
| Charles English | Labor | 1953–1957 | |
| Queensland Labor | 1957 | ||
| Bob Watson | Country | 1957–1959 | |
| Carlisle Wordsworth | Country | 1959–1960 | |
| Roy Armstrong | Country | 1960–1974 | |
| National | 1974–1980 | ||
| Max Menzel | National | 1980–1989 | |
| Warren Pitt | Labor | 1989–1995 | |
| Naomi Wilson | National | 1995–1998 | |
| Charles Rappolt | One Nation | 1998 | |
| Warren Pitt | Labor | 1998–2009 | |
| Curtis Pitt | Labor | 2009–present | |
Election results
| Party | Candidate | Votes | % | ± | |
|---|---|---|---|---|---|
| Labor | Curtis Pitt | 13,256 | 48.1 | −2.8 | |
| Liberal National | Karina Samperi | 6,287 | 22.8 | −8.6 | |
| One Nation | Sue Bertuch | 6,158 | 22.3 | +22.3 | |
| Greens | Carmel Murray | 1,857 | 6.7 | +2.7 | |
| Total formal votes | 27,558 | 95.1 | −2.6 | ||
| Informal votes | 1,416 | 4.9 | +2.6 | ||
| Turnout | 28,974 | 84.7 | −0.6 | ||
| Two-party-preferred result | |||||
| Labor | Curtis Pitt | 16,789 | 60.9 | −2.0 | |
| Liberal National | Karina Samperi | 10,769 | 39.1 | +2.0 | |
| Labor hold | Swing | −2.0 | |||
References
- "Representatives of Queensland State Electorates 1860-2017" (PDF). Queensland Parliamentary Record 2012-2017: The 55th Parliament. Queensland Parliament. Archived from the original on 27 April 2020. Retrieved 27 April 2020.CS1 maint: unfit url (link)
- 2017 State General Election - Mulgrave - District Summary, ECQ.
External links
This article is issued from Wikipedia. The text is licensed under Creative Commons - Attribution - Sharealike. Additional terms may apply for the media files.