Density of air
The density of air or atmospheric density, denoted ρ (Greek: rho), is the mass per unit volume of Earth's atmosphere. Air density, like air pressure, decreases with increasing altitude. It also changes with variation in atmospheric pressure, temperature and humidity. At 1013.25 hPa (abs) and 15°C, air has a density of approximately 1.225 kg/m³ (or 0.00237 slug/ft³), about 1/1000th that of water) according to ISA (International Standard Atmosphere).
Air density is a property used in many branches of science, engineering, and industry, including aeronautics;[1][2][3] gravimetric analysis;[4] the air-conditioning[5] industry; atmospheric research and meteorology;[6][7][8] agricultural engineering (modeling and tracking of Soil-Vegetation-Atmosphere-Transfer (SVAT) models);[9][10][11] and the engineering community that deals with compressed air.[12]
Depending on the measuring instruments used, different sets of equations for the calculation of the density of air can be applied. Air is a mixture of gases and the calculations always simplify, to a greater or lesser extent, the properties of the mixture.
Dry air
The density of dry air can be calculated using the ideal gas law, expressed as a function of temperature and pressure:

where:
- air density (kg/m³)[note 1]
- absolute pressure (Pa)[note 1]
- absolute temperature (K)[note 1]
- specific gas constant for dry air (J/(kg·K))[note 1]


The specific gas constant for dry air is 287.058 J/(kg·K) in SI units, and 53.35 (ft·lbf)/(lb·°R) in United States customary and Imperial units. This quantity may vary slightly depending on the molecular composition of air at a particular location.
Therefore:
- At IUPAC standard temperature and pressure (0 °C and 100 kPa), dry air has a density of 1.2754 kg/m³.
- At 20 °C and 101.325 kPa, dry air has a density of 1.2041 kg/m³.
- At 70 °F and 14.696 psi, dry air has a density of 0.074887 lb/ft³.
The following table illustrates the air density–temperature relationship at 1 atm or 101.325 kPa:
| Temperature T (°C) |
Speed of sound c (m/s) |
Density of air ρ (kg/m3) |
Characteristic specific acoustic impedance z0 (Pa·s/m) |
|---|---|---|---|
| 35 | 351.88 | 1.1455 | 403.2 |
| 30 | 349.02 | 1.1644 | 406.5 |
| 25 | 346.13 | 1.1839 | 409.4 |
| 20 | 343.21 | 1.2041 | 413.3 |
| 15 | 340.27 | 1.2250 | 416.9 |
| 10 | 337.31 | 1.2466 | 420.5 |
| 5 | 334.32 | 1.2690 | 424.3 |
| 0 | 331.30 | 1.2922 | 428.0 |
| −5 | 328.25 | 1.3163 | 432.1 |
| −10 | 325.18 | 1.3413 | 436.1 |
| −15 | 322.07 | 1.3673 | 440.3 |
| −20 | 318.94 | 1.3943 | 444.6 |
| −25 | 315.77 | 1.4224 | 449.1 |
Humid air
The addition of water vapor to air (making the air humid) reduces the density of the air, which may at first appear counter-intuitive. This occurs because the molar mass of water (18 g/mol) is less than the molar mass of dry air[note 2] (around 29 g/mol). For any ideal gas, at a given temperature and pressure, the number of molecules is constant for a particular volume (see Avogadro's Law). So when water molecules (water vapor) are added to a given volume of air, the dry air molecules must decrease by the same number, to keep the pressure or temperature from increasing. Hence the mass per unit volume of the gas (its density) decreases.
The density of humid air may be calculated by treating it as a mixture of ideal gases. In this case, the partial pressure of water vapor is known as the vapor pressure. Using this method, error in the density calculation is less than 0.2% in the range of −10 °C to 50 °C. The density of humid air is found by:

where:
- Density of the humid air (kg/m³)
- Partial pressure of dry air (Pa)
- Specific gas constant for dry air, 287.058 J/(kg·K)
- Temperature (K)
- Pressure of water vapor (Pa)
- Specific gas constant for water vapor, 461.495 J/(kg·K)
- Molar mass of dry air, 0.0289654 kg/mol
- Molar mass of water vapor, 0.018016 kg/mol
- Universal gas constant, 8.314 J/(K·mol)


The vapor pressure of water may be calculated from the saturation vapor pressure and relative humidity. It is found by:

where:
- Vapor pressure of water
- Relative humidity
- Saturation vapor pressure


The saturation vapor pressure of water at any given temperature is the vapor pressure when relative humidity is 100%. One formula [14] used to find the saturation vapor pressure [Pa] is:

where is in degrees C. See vapor pressure of water for other equations.
- note:
The partial pressure of dry air is found considering partial pressure, resulting in:


Where simply denotes the observed absolute pressure.

Variation with altitude
Troposphere
To calculate the density of air as a function of altitude, one requires additional parameters. For the troposphere, the lowest part of the atmosphere, they are listed below, along with their values according to the International Standard Atmosphere, using for calculation the universal gas constant instead of the air specific constant:
- sea level standard atmospheric pressure, 101325 Pa
- sea level standard temperature, 288.15 K
- earth-surface gravitational acceleration, 9.80665 m/s²
- temperature lapse rate, 0.0065 K/m
- ideal (universal) gas constant, 8.31447 J/(mol·K)
- molar mass of dry air, 0.0289654 kg/mol


Temperature at altitude meters above sea level is approximated by the following formula (only valid inside the troposphere, no more than ~18 km above Earth's surface (and lower away from Equator)):


The pressure at altitude is given by:

Density can then be calculated according to a molar form of the ideal gas law:

where:
- molar mass
- ideal gas constant
- absolute temperature
- absolute pressure
Note that the density close to the ground is

It can be easily verified that the hydrostatic equation holds:
- .

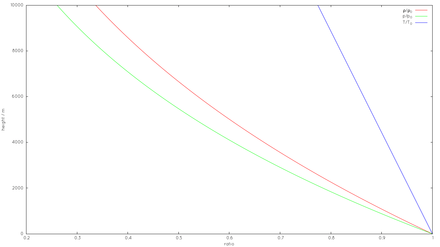
Exponential approximation
As the temperature varies with height inside the troposphere by less than 25%, and one may approximate:


Thus:

Which is identical to the isothermal solution, except that Hn, the height scale of the exponential fall for density (as well as for number density n), is not equal to RT0/g M as one would expect for an isothermal atmosphere, but rather:

Which gives Hn = 10.4 km.
Note that for different gasses, the value of Hn differs, according to the molar mass M: It is 10.9 for nitrogen, 9.2 for oxygen and 6.3 for carbon dioxide. The theoretical value for water vapor is 19.6, but due to vapor condensation the water vapor density dependence is highly variable and is not well approximated by this formula.
The pressure can be approximated by another exponent:

Which is identical to the isothermal solution, with the same height scale Hp = RT0/gM. Note that the hydrostatic equation no longer holds for the exponential approximation (unless L is neglected).
Hp is 8.4 km, but for different gasses (measuring their partial pressure), it is again different and depends upon molar mass, giving 8.7 for nitrogen, 7.6 for oxygen and 5.6 for carbon dioxide.
Total content
Further note that since g, Earth's gravitational acceleration, is approximately constant with altitude in the atmosphere, the pressure at height h is proportional to the integral of the density in the column above h, and therefore to the mass in the atmosphere above height h. Therefore the mass fraction of the troposphere out of all the atmosphere is given using the approximated formula for p:

For nitrogen, it is 75% , while for oxygen this is 79%, and for carbon dioxide - 88%.
Tropopause
Higher than the troposphere, at the tropopause, the temperature is approximately constant with altitude (up to ~20 km) and is 220 K. This means that at this layer L = 0 and T= 220K, so that the exponential drop is faster, with HTP = 6.3 km for air (6.5 for nitrogen, 5.7 for oxygen and 4.2 for carbon dioxide). Both the pressure and density obey this law, so, denoting the height of the border between the troposphere and the tropopause as U:


Composition
| Gas (and others) | Volume by various[15][▽note 2] | Volume by CIPM-2007[16] | Volume by ASHRAE[17] | Volume by Schlatter[18] | Volume by ICAO[19] | Volume by US StdAtm76[20] | ▼ Tap this text to expand or collapse the table ▲ | |||||||
| ppmv[▽note 3] | percentile | ppmv | percentile | ppmv | percentile | ppmv | percentile | ppmv | percentile | ppmv | percentile | |||
| Nitrogen | (N2) | 780,800 | (78.080%) | 780,848 | (78.0848%) | 780,818 | (78.0818%) | 780,840 | (78.084%) | 780,840 | (78.084%) | 780,840 | (78.084%) | |
| Oxygen | (O2) | 209,500 | (20.950%) | 209,390 | (20.9390%) | 209,435 | (20.9435%) | 209,460 | (20.946%) | 209,476 | (20.9476%) | 209,476 | (20.9476%) | |
| Argon | (Ar) | 9,340 | (0.9340%) | 9,332 | (0.9332%) | 9,332 | (0.9332%) | 9,340 | (0.9340%) | 9,340 | (0.9340%) | 9,340 | (0.9340%) | |
| Carbon dioxide | (CO2) | 397.8 | (0.03978%) | 400 | (0.0400%) | 385 | (0.0385%) | 384 | (0.0384%) | 314 | (0.0314%) | 314 | (0.0314%) | |
| Neon | (Ne) | 18.18 | (0.001818%) | 18.2 | (0.00182%) | 18.2 | (0.00182%) | 18.18 | (0.001818%) | 18.18 | (0.001818%) | 18.18 | (0.001818% ) | |
| Helium | (He) | 5.24 | (0.000524%) | 5.2 | (0.00052%) | 5.2 | (0.00052%) | 5.24 | (0.000524%) | 5.24 | (0.000524%) | 5.24 | (0.000524% ) | |
| Methane | (CH4) | 1.81 | (0.000181%) | 1.5 | (0.00015%) | 1.5 | (0.00015%) | 1.774 | (0.0001774%) | 2 | (0.0002%) | 2 | (0.0002%) | |
| Krypton | (Kr) | 1.14 | (0.000114%) | 1.1 | (0.00011%) | 1.1 | (0.00011%) | 1.14 | (0.000114%) | 1.14 | (0.000114%) | 1.14 | (0.000114%) | |
| Hydrogen | (H2) | 0.55 | (0.000055%) | 0.5 | (0.00005%) | 0.5 | (0.00005%) | 0.56 | (0.000056%) | 0.5 | (0.00005%) | 0.5 | (0.00005%) | |
| Nitrous oxide | (N2O) | 0.325 | (0.0000325%) | 0.3 | (0.00003%) | 0.3 | (0.00003%) | 0.320 | (0.0000320%) | 0.5 | (0.00005%) | - | - | |
| Carbon monoxide | (CO) | 0.1 | (0.00001% ) | 0.2 | (0.00002%) | 0.2 | (0.00002%) | - | - | - | - | - | - | |
| Xenon | (Xe) | 0.09 | (0.000009%) | 0.1 | (0.00001%) | 0.1 | (0.00001%) | 0.09 | (0.000009%) | 0.087 | (0.0000087%) | 0.087 | (0.0000087%) | |
| Nitrogen dioxide | (NO2) | 0.02 | (0.000002%) | - | - | - | - | - | - | up to 0.02 | up to (0.000002%) | - | - | |
| Iodine | (I2) | 0.01 | (0.000001%) | - | - | - | - | - | - | up to 0.01 | up to (0.000001%) | - | - | |
| Ammonia | (NH3) | trace | trace | - | - | - | - | - | - | - | - | |||
| Sulphur dioxide | (SO2) | trace | trace | - | - | - | - | - | - | up to 1.00 | up to (0.0001%) | - | - | |
| Ozone | (O3) | 0.02 to 0.07 | (2 to 7×10⁻⁶%) | - | - | - | - | 0.01 to 0.10 | (1 to 10×10−6%) | up to 0.02 to 0.07 | up to (2 to 7×10⁻⁶%) | - | - | |
| Trace to 30 ppm [▽note 6] | (----) | - | - | - | - | 2.9 | (0.00029%) | - | - | - | - | - | - | |
| Dry air total | (air) | 1,000,065.265 | (100.0065265%) | 999,997.100 | (99.9997100%) | 1,000,000.000 | (100.0000000%) | 1,000,051.404 | (100.0051404%) | 999,998.677 | (99.9998677%) | 1,000,080.147 | (100.0080147%) | |
| Not included in above dry atmosphere: | ||||||||||||||
| Water vapor | (H2O) | ~0.25% by mass over full atmosphere, locally 0.001%–5% by volume.[21] | ~0.25% by mass over full atmosphere, locally 0.001%–5% by volume.[21] | |||||||||||
|---|---|---|---|---|---|---|---|---|---|---|---|---|---|---|
|
||||||||||||||
See also
Notes
- In the SI unit system. However, other units can be used.
- as dry air is a mixture of gases, its molar mass is the weighted average of the molar masses of its components
References
- Olson, Wayne M. (2000) AFFTC-TIH-99-01, Aircraft Performance Flight
- ICAO, Manual of the ICAO Standard Atmosphere (extended to 80 kilometres (262 500 feet)), Doc 7488-CD, Third Edition, 1993, ISBN 92-9194-004-6.
- Grigorie, T.L., Dinca, L., Corcau J-I. and Grigorie, O. (2010) Aircrafts’ [sic] Altitude Measurement Using Pressure Information:Barometric Altitude and Density Altitude
- A., Picard, R.S., Davis, M., Gläser and K., Fujii (CIPM-2007) Revised formula for the density of moist air
- S. Herrmann, H.-J. Kretzschmar, and D.P. Gatley (2009), ASHRAE RP-1485 Final Report
- F.R. Martins, R.A. Guarnieri e E.B. Pereira, (2007) O aproveitamento da energia eólica (The wind energy resource).
- Andrade, R.G., Sediyama, G.C., Batistella, M., Victoria, D.C., da Paz, A.R., Lima, E.P., Nogueira, S.F. (2009) Mapeamento de parâmetros biofísicos e da evapotranspiração no Pantanal usando técnicas de sensoriamento remoto
- Marshall, John and Plumb, R. Alan (2008), Atmosphere, ocean, and climate dynamics: an introductory text ISBN 978-0-12-558691-7.
- Pollacco, J. A., and B. P. Mohanty (2012), Uncertainties of Water Fluxes in Soil-Vegetation-Atmosphere Transfer Models: Inverting Surface Soil Moisture and Evapotranspiration Retrieved from Remote Sensing, Vadose Zone Journal, 11(3), doi:10.2136/vzj2011.0167.
- Shin, Y., B. P. Mohanty, and A.V.M. Ines (2013), Estimating Effective Soil Hydraulic Properties Using Spatially Distributed Soil Moisture and Evapotranspiration, Vadose Zone Journal, 12(3), doi:10.2136/vzj2012.0094.
- Saito, H., J. Simunek, and B. P. Mohanty (2006), Numerical Analysis of Coupled Water, Vapor, and Heat Transport in the Vadose Zone, Vadose Zone J. 5: 784-800.
- Perry, R.H. and Chilton, C.H., eds., Chemical Engineers’ Handbook, 5th ed., McGraw-Hill, 1973.
- Shelquist, R (2009) Equations - Air Density and Density Altitude
- Shelquist, R (2009) Algorithms - Schlatter and Baker
- Partial sources for figures: Base constituents, Nasa earth factsheet, (updated 2014-03). Carbon dioxide, NOAA Earth System Research Laboratory, (updated 2014-03). Methane and Nitrous Oxide, The NOAA Annual greenhouse gas index(AGGI) Greenhouse gas-Figure 2, (updated 2014-03).
- A., Picard, R.S., Davis, M., Gläser and K., Fujii (2008), Revised formula for the density of moist air (CIPM-2007), Metrologia 45 (2008) 149–155 doi:10.1088/0026-1394/45/2/004, pg 151 Table 1
- S. Herrmann, H.-J. Kretzschmar, and D.P. Gatley (2009), ASHRAE RP-1485 Final Report Thermodynamic Properties of Real Moist Air,Dry Air, Steam, Water, and Ice pg 16 Table 2.1 and 2.2
- Thomas W. Schlatter (2009), Atmospheric Composition and Vertical Structure pg 15 Table 2
- ICAO, Manual of the ICAO Standard Atmosphere (extended to 80 kilometres (262 500 feet)), Doc 7488-CD, Third Edition, (1993), ISBN 92-9194-004-6. pg E-x Table B
- U.S. Committee on Extension to the Standard Atmosphere (COESA) (1976) U.S. Standard Atmosphere, 1976 pg 03 Table 3
- Wallace, John M. and Peter V. Hobbs. Atmospheric Science; An Introductory Survey.Elsevier. Second Edition, 2006. ISBN 978-0-12-732951-2. Chapter 1
External links
- Conversions of density units ρ by Sengpielaudio
- Air density and density altitude calculations and by Richard Shelquist
- Air density calculations by Sengpielaudio (section under Speed of sound in humid air)
- Air density calculator by Engineering design encyclopedia
- Atmospheric pressure calculator by wolfdynamics
- Air iTools - Air density calculator for mobile by JSyA