Demographics of Canberra
Canberra is Australia's capital and its largest inland city. At the 2016 census, it had 395,790 residents.[1] This amounted to only 1.7% of Australia's population. The population density for Canberra is 443.5 people per sq kilometre.
At the 2016 census, 32% of Canberra's population were born overseas, a large majority which come from Asia and Europe.
The estimated population for Canberra as of 2016 was 395,790, constituting 194,879 males and 200,914 females.[1] The 2016 unemployment rate was around 4.7%.[1]
History
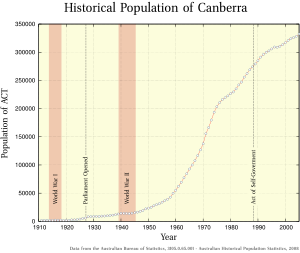
The first few decades after the establishment of Canberra growth was relatively slow due to low funds after World War I. The population was nearly 2000 at the time. Until the end of World War II development was completely put on hold due to the Great Depression.
Office development accelerated rapidly in the 1960s in Civic. From 1960 - 1971, the population tripled from 50,000 inhabitants to 146,000 and climbing to 203,000 in 1976. The Australian economy went into recession in 1975, and a year later the construction industries in Canberra collapsed.
In modern times, the growth completely slowed in 1996 - 2001. However, the city experiences over 1 percent growth annually.[2] The population in 2016 was around 395,790.[1]
| Population of the ACT | ||
|---|---|---|
| Year | Pop. | ±% |
| 1911 | 1,777 | — |
| 1921 | 2,583 | +45.4% |
| 1933 | 8,947 | +246.4% |
| 1947 | 16,905 | +88.9% |
| 1954 | 30,315 | +79.3% |
| 1961 | 58,828 | +94.1% |
| 1966 | 96,032 | +63.2% |
| 1971 | 151,169 | +57.4% |
| 1976 | 207,740 | +37.4% |
| 1981 | 227,581 | +9.6% |
| 1986 | 258,910 | +13.8% |
| 1991 | 289,320 | +11.7% |
| 1996 | 308,251 | +6.5% |
| 2001 | 307,053 | −0.4% |
| 2006 | 322,036 | +4.9% |
| 2011 | 357,222 | +10.9% |
| 2016 | 397,397 | +11.2% |
| Source: Censuses[3][4][5][6] | ||
Populations by district
Most of Canberra's growth since 1991 has taken place in Gungahlin.
| Population of Canberra districts | 1991[7] | 1996 | 2001 | 2006 | 2011 | 2016 |
|---|---|---|---|---|---|---|
| North Canberra | 40,249 | 38,818 | 38,585 | 43,757 | 48,030[8] | 53,002[9] |
| South Canberra | 22,371 | 22,730 | 23,324 | 24,581 | 24,154[10] | 27,007[11] |
| Belconnen | 89,519 | 85,659 | 81,701 | 87,246 | 92,444[12] | 96,049[13] |
| Woden Valley | 33,921 | 33,043 | 32,494 | 31,992 | 32,958[14] | 34,760[15] |
| Weston Creek | 27,268 | 24,879 | 23,662 | 22,886 | 22,746[16] | 22,988[17] |
| Tuggeranong | 74,412 | 90,104 | 90,875 | 89,666 | 86,900[18] | 85,154[19] |
| Gungahlin | 455 | 12,684 | 24,398 | 32,550 | 47,303 [20] | 71,142[21] |
| Total Canberra | 288,195 | 307,917 | 307,053 | 322,036 | 355,596[22] | 395,790[1] |
Ancestry and immigration
| Country of Birth (2016)[23] | |
|---|---|
| Birthplace[N 1] | Population |
| Australia | 269,682 |
| England | 12,739 |
| Mainland China | 11,334 |
| India | 10,405 |
| New Zealand | 4,722 |
| Philippines | 3,789 |
| Vietnam | 3,340 |
| United States | 2,775 |
| Sri Lanka | 2,774 |
| Malaysia | 2,431 |
| South Korea | 2,283 |
At the 2016 census, the most commonly nominated ancestries were:[N 2][24]
The 2016 census showed that 32% of Canberra's inhabitants were born overseas.[26] Of inhabitants born outside of Australia, the most prevalent countries of birth were England, China, India, New Zealand and the Philippines.[27]
1.6% of the population, or 6,476 people, identified as Indigenous Australians (Aboriginal Australians and Torres Strait Islanders) in 2016.[N 5][28]
Language
At the 2016 census, 72.7 of people spoke only English at home. The other languages most commonly spoken at home were Mandarin (3.1%), Vietnamese (1.1%), Cantonese (1%), Hindi (0.9%) and Spanish (0.8%).[29]
Religion
At the 2011 census, the most common responses for religion were no religion (36.2%) Catholic (22.3%), Anglican (10.7%), not stated (9.1%) and Hinduism (2.6%).[1]
Demographic Statistics
The following statistics are from the Australian Bureau of Statistics.[30][31]
Median age
- 34 years of age[1]
Age structure
- 0-14 years: 18.7% (74,213)
- 15–64 years: 68.7% (271,762)
- 65 years and over: 12.7% (49,828)[1]
Population growth rate
- 1.6%
Birth rate
- 13.5 births/1,000 population (2010 est.)
Death rate
- 4.5 deaths/1,000 population (July 2010 est.)
Life expectancy
As of 2013-2015, the Australian Capital Territory has the highest life expectancy in Australia. The life expectancy at birth for males is 81.2 years and 85.3 years for females.[32]
Sex ratios
- There were 99.0 males for every 100 females in Canberra as of 2010.
- Civic had the highest sex ratio (137.2 males for every 100 females.)
- Deakin had the lowest sex ratio (80.6 males for every 100 females.)
Total fertility rate
- 1.6 children born/woman (2001 est.)[33]
Unemployment rate
4.5%
Notes
- In accordance with the Australian Bureau of Statistics source, England, Scotland, Mainland China and the Special Administrative Regions of Hong Kong and Macau are listed separately
- As a percentage of 373,561 persons who nominated their ancestry at the 2016 census.
- The Australian Bureau of Statistics has stated that most who nominate "Australian" as their ancestry are part of the Anglo-Celtic group.[25]
- Of any ancestry. Includes those identifying as Aboriginal Australians or Torres Strait Islanders. Indigenous identification is separate to the ancestry question on the Australian Census and persons identifying as Aboriginal or Torres Strait Islander may identify any ancestry.
- Of any ancestry. Includes those identifying as Aboriginal Australians or Torres Strait Islanders. Indigenous identification is separate to the ancestry question on the Australian Census and persons identifying as Aboriginal or Torres Strait Islander may identify any ancestry.
References
- Australian Bureau of Statistics (27 June 2017). "Canberra - Queanbeyan (Canberra Part)". 2016 Census QuickStats. Retrieved 29 October 2017.

- "History of Canberra". Archived from the original on 23 July 2012. Retrieved 21 July 2012.
- "3105.0.65.001 - Australian Historical Population Statistics, 2006". Australian Bureau of Statistics. 23 May 2006. Retrieved 13 February 2018.
- "Australian Capital Territory". 2006 Census QuickStats. Australian Bureau of Statistics. 25 October 2007. Retrieved 13 February 2018.
- "Australian Capital Territory". 2011 Census QuickStats. Australian Bureau of Statistics. 28 March 2013. Retrieved 13 February 2018.
- "Australian Capital Territory". 2016 Census QuickStats. Australian Bureau of Statistics. 23 October 2017. Retrieved 13 February 2018.
- McLennan, W. (May 1998). "1996 Census of Population and Housing" (PDF). Australian Bureau of Statistics. Department of the Environment. pp. 98–100. ISBN 0 642 25690 X. Retrieved 7 April 2015.
- Australian Bureau of Statistics (31 October 2012). "North Canberra (Statistical Subdivision)". 2011 Census QuickStats. Retrieved 29 January 2015.
- Australian Bureau of Statistics (27 June 2017). "North Canberra (Statistical Subdivision)". 2016 Census QuickStats. Retrieved 29 October 2017.
- Australian Bureau of Statistics (31 October 2012). "South Canberra (Statistical Subdivision)". 2011 Census QuickStats. Retrieved 29 January 2015.
- Australian Bureau of Statistics (27 June 2017). "South Canberra (Statistical Subdivision)". 2016 Census QuickStats. Retrieved 29 October 2017.
- Australian Bureau of Statistics (31 October 2012). "Belconnen (SA3)". 2011 Census QuickStats. Retrieved 29 January 2015.
- Australian Bureau of Statistics (27 June 2017). "Belconnen (Statistical Subdivision)". 2016 Census QuickStats. Retrieved 29 October 2017.
- Australian Bureau of Statistics (31 October 2012). "Woden (SA3)". 2011 Census QuickStats. Retrieved 29 January 2015.
- Australian Bureau of Statistics (27 June 2017). "Woden Valley (Statistical Subdivision)". 2016 Census QuickStats. Retrieved 29 October 2017.
- Australian Bureau of Statistics (31 October 2012). "Weston Creek (SA3)". 2011 Census QuickStats. Retrieved 29 January 2015.
- Australian Bureau of Statistics (27 June 2017). "Weston Creek (Statistical Subdivision)". 2016 Census QuickStats. Retrieved 29 October 2017.
- Australian Bureau of Statistics (31 October 2012). "Tuggeranong (SA3)". 2011 Census QuickStats. Retrieved 29 January 2015.
- Australian Bureau of Statistics (27 June 2017). "Tuggeranong (Statistical Subdivision)". 2016 Census QuickStats. Retrieved 29 October 2017.
- Australian Bureau of Statistics (31 October 2012). "Gungahlin (SA3)". 2011 Census QuickStats. Retrieved 29 January 2015.
- Australian Bureau of Statistics (27 June 2017). "Gungahlin (Statistical Subdivision)". 2016 Census QuickStats. Retrieved 29 October 2017.
- Australian Bureau of Statistics (31 October 2012). "Canberra - Queanbeyan (Canberra Part)". 2011 Census QuickStats. Retrieved 29 January 2015.
- https://quickstats.censusdata.abs.gov.au/census_services/getproduct/census/2016/communityprofile/8ACTE?opendocument
- https://quickstats.censusdata.abs.gov.au/census_services/getproduct/census/2016/communityprofile/8ACTE?opendocument
- Statistics, c=AU; o=Commonwealth of Australia; ou=Australian Bureau of. "Feature Article - Ethnic and Cultural Diversity in Australia (Feature Article)". www.abs.gov.au.
- https://quickstats.censusdata.abs.gov.au/census_services/getproduct/census/2016/communityprofile/8ACTE?opendocument
- https://quickstats.censusdata.abs.gov.au/census_services/getproduct/census/2016/quickstat/8ACTE?opendocument
- https://quickstats.censusdata.abs.gov.au/census_services/getproduct/census/2016/communityprofile/8ACTE?opendocument
- https://quickstats.censusdata.abs.gov.au/census_services/getproduct/census/2016/communityprofile/8ACTE?opendocument
- Population in 2010. Retrieved 4 August 2011.
- Canberra at the 2011 census. Retrieved 21 June 2012.
- "3302.0.55.001 - Life Tables, States, Territories and Australia, 2013-2015". Australian Bureau of Statistics. 2016. Archived from the original on 13 May 2017. Retrieved 6 May 2017.
- Fertility rate of Australia in 2001 Australian Bureau of Statistics. 31 October 2001. Retrieved 31 October 2001.