Connectogram
Connectograms are graphical representations of connectomics, the field of study dedicated to mapping and interpreting all of the white matter fiber connections in the human brain. These circular graphs based on diffusion MRI data utilize graph theory to demonstrate the white matter connections and cortical characteristics for single structures, single subjects, or populations.
Structure

Background and description
The connectogram, as a graphical representation of brain connectomics, was proposed in 2012.[1]
Circular representations of connections have been used in a number of disciplines; examples include representation of aspects of epidemics,[2] geographical networks,[3] musical beats,[4] diversity in bird populations,[5] and genomic data.[6] Connectograms were also cited as a source of inspiration for the heads-up display style of Tony Stark's helmet in Iron Man 3.[7]
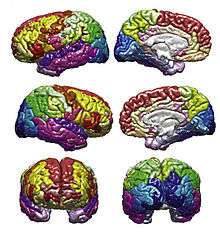
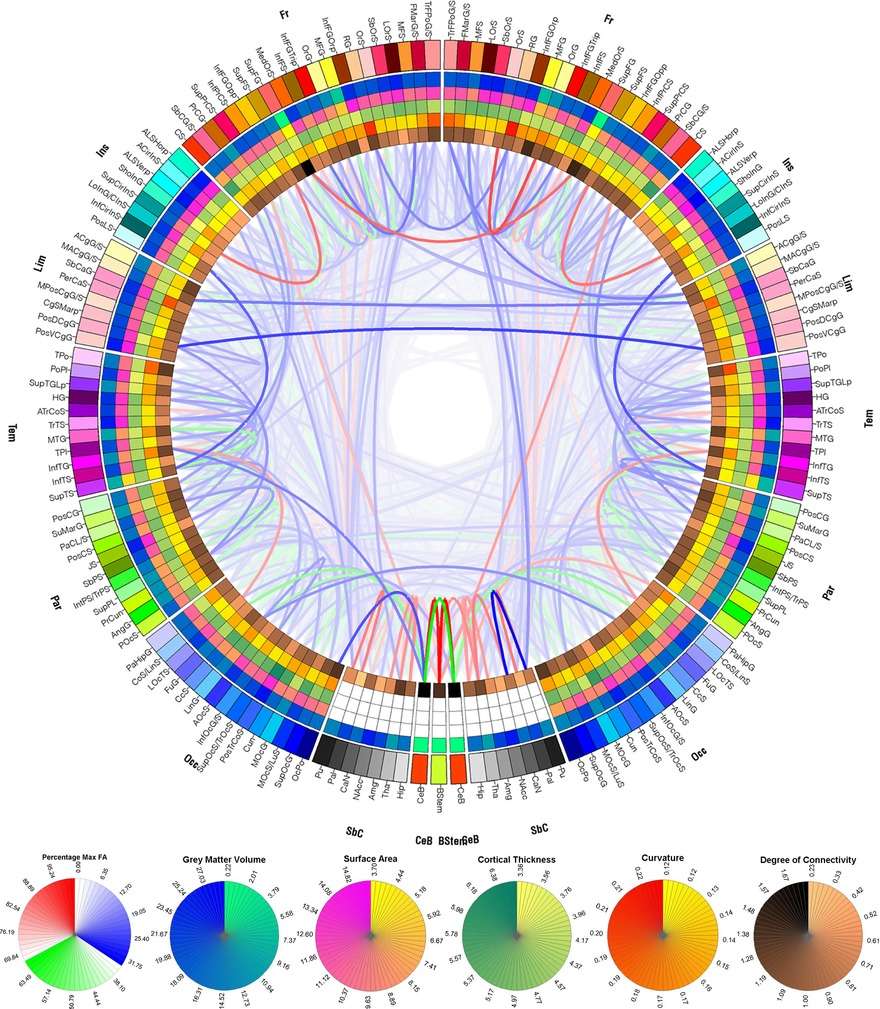
Connectograms are circular, with the left half depicting the left hemisphere and the right half depicting the right hemisphere. The hemispheres are further broken down into frontal lobe, insular cortex, limbic lobe, temporal lobe, parietal lobe, occipital lobe, subcortical structures, and cerebellum. At the bottom the brain stem is also represented between the two hemispheres. Within these lobes, each cortical area is labeled with an abbreviation and assigned its own color, which can be used to designate these same cortical regions in other figures, such as the parcellated brain surfaces in the adjacent image, so that the reader can find the corresponding cortical areas on a geometrically accurate surface and see exactly how disparate the connected regions may be. Inside the cortical surface ring, the concentric circles each represent different attributes of the corresponding cortical regions. In order from outermost to innermost, these metric rings represent the grey matter volume, surface area, cortical thickness, curvature, and degree of connectivity (the relative proportion of fibers initiating or terminating in the region compared to the whole brain). Inside these circles, lines connect regions that are found to be structurally connected. The relative density (number of fibers) of these connections is reflected in the opacity of the lines, so that one can easily compare various connections and their structural importance. The fractional anisotropy of each connection is reflected in its color.[1]
Uses
Brain mapping
With the recent concerted push to map all of the human brain and its connections,[8][9] it has become increasingly important to find ways to graphically represent the large amounts of data involved in connectomics. Most other representations of the connectome use 3 dimensions, and therefore require an interactive graphical user interface.[1] The connectogram can display 83 cortical regions within each hemisphere, and visually display which areas are structurally connected, all on a flat surface. It is therefore conveniently filed in patient records, or to display in print. The graphs were originally developed using the visualization tool called Circos,.[10][11]
Clinical use
On an individual level, connectograms can be used to inform the treatment of patients with neuroanatomical abnormalities. Connectograms have been used to monitor the progression of neurological recovery of patients who suffered a traumatic brain injury (TBI).[12] They have also been applied to famous patient Phineas Gage, to estimate damage to his neural network (as well as the damage at the cortical level—the primary focus of earlier studies on Gage).[13]
Empirical study
Connectograms can represent the averages of cortical metrics (grey matter volume, surface area, cortical thickness, curvature, and degree of connectivity), as well as tractography data, such as the average densities and fractional anisotropy of the connections, across populations of any size. This allows for visual and statistical comparison between groups such as males and females,[14] differing age cohorts, or healthy controls and patients. Some versions have been used to analyze how partitioned networks are in patient populations[15] or the relative balance between inter- and intra-hemispheric connections.[16]
Modified versions
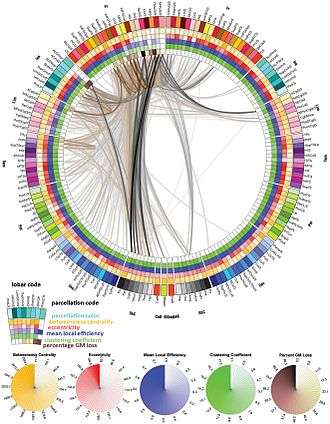
There are many possibilities for which measures are included in the rings of a connectogram. Irimia and Van Horn (2012) have published connectograms which examine the correlative relationships between regions and uses the figures to compare the approaches of graph theory and connectomics.[17] Some have been published without the inner circles of cortical metrics.[18] Others include additional measures relating to neural networks,[19] which can be added as additional rings to the inside to show metrics of graph theory, as in the extended connectogram here:

Regions and their abbreviations
| Acronym | Region in connectogram |
|---|---|
| ACgG/S | Anterior part of the cingulate gyrus and sulcus |
| ACirInS | Anterior segment of the circular sulcus of the insula |
| ALSHorp | Horizontal ramus of the anterior segment of the lateral sulcus (or fissure) |
| ALSVerp | Vertical ramus of the anterior segment of the lateral sulcus (or fissure) |
| AngG | Angular gyrus |
| AOcS | Anterior occipital sulcus and preoccipital notch (temporo-occipital incisure) |
| ATrCoS | Anterior transverse collateral sulcus |
| CcS | Calcarine sulcus |
| CgSMarp | Marginal branch (or part) of the cingulate sulcus |
| CoS/LinS | Medial occipito-temporal sulcus (collateral sulcus) and lingual sulcus |
| CS | Central sulcus (Rolando’s fissure) |
| Cun | Cuneus |
| FMarG/S | Fronto-marginal gyrus (of Wernicke) and sulcus |
| FuG | Lateral occipito-temporal gyrus (fusiform gyrus) |
| HG | Heschl’s gyrus (anterior transverse temporal gyrus) |
| InfCirInS | Inferior segment of the circular sulcus of the insula |
| InfFGOpp | Opercular part of the inferior frontal gyrus |
| InfFGOrp | Orbital part of the inferior frontal gyrus |
| InfFGTrip | Triangular part of the inferior frontal gyrus |
| InfFS | Inferior frontal sulcus |
| InfOcG/S | Inferior occipital gyrus and sulcus |
| InfPrCS | Inferior part of the precentral sulcus |
| IntPS/TrPS | Intraparietal sulcus (interparietal sulcus) and transverse parietal sulci |
| InfTG | Inferior temporal gyrus |
| InfTS | Inferior temporal sulcus |
| JS | Sulcus intermedius primus (of Jensen) |
| LinG | Lingual gyrus, lingual part of the medial occipito-temporal gyrus |
| LOcTS | Lateral occipito-temporal sulcus |
| LoInG/CInS | Long insular gyrus and central insular sulcus |
| LOrS | Lateral orbital sulcus |
| MACgG/S | Middle-anterior part of the cingulate gyrus and sulcus |
| MedOrS | Medial orbital sulcus (olfactory sulcus) |
| MFG | Middle frontal gyrus |
| MFS | Middle frontal sulcus |
| MOcG | Middle occipital gyrus, lateral occipital gyrus |
| MOcS/LuS | Middle occipital sulcus and lunatus sulcus |
| MPosCgG/S | Middle-posterior part of the cingulate gyrus and sulcus |
| MTG | Middle temporal gyrus |
| OcPo | Occipital pole |
| OrG | Orbital gyri |
| OrS | Orbital sulci (H-shaped sulci) |
| PaCL/S | Paracentral lobule and sulcus |
| PaHipG | Parahippocampal gyrus, parahippocampal part of the medial occipito-temporal gyrus |
| PerCaS | Pericallosal sulcus (S of corpus callosum) |
| POcS | Parieto-occipital sulcus (or fissure) |
| PoPl | Polar plane of the superior temporal gyrus |
| PosCG | Postcentral gyrus |
| PosCS | Postcentral sulcus |
| PosDCgG | Posterior-dorsal part of the cingulate gyrus |
| PosLS | Posterior ramus (or segment) of the lateral sulcus (or fissure) |
| PosTrCoS | Posterior transverse collateral sulcus |
| PosVCgG | Posterior-ventral part of the cingulate gyrus (isthmus of the cingulate gyrus) |
| PrCG | Precentral gyrus |
| PrCun | Precuneus |
| RG | Straight gyrus (gyrus rectus) |
| SbCaG | Subcallosal area, subcallosal gyrus |
| SbCG/S | Subcentral gyrus (central operculum) and sulci |
| SbOrS | Suborbital sulcus (sulcus rostrales, supraorbital sulcus) |
| SbPS | Subparietal sulcus |
| ShoInG | Short insular gyri |
| SuMarG | Supramarginal gyrus |
| SupCirInS | Superior segment of the circular sulcus of the insula |
| SupFG | Superior frontal gyrus |
| SupFS | Superior frontal sulcus |
| SupOcG | Superior occipital gyrus |
| SupPrCS | Superior part of the precentral sulcus |
| SupOcS/TrOcS | Superior occipital sulcus and transverse occipital sulcus |
| SupPL | Superior parietal lobule |
| SupTGLp | Lateral aspect of the superior temporal gyrus |
| SupTS | Superior temporal sulcus |
| TPl | Temporal plane of the superior temporal gyrus |
| TPo | Temporal pole |
| TrFPoG/S | Transverse frontopolar gyri and sulci |
| TrTS | Transverse temporal sulcus |
| Amg | Amygdala |
| CaN | Caudate nucleus |
| Hip | Hippocampus |
| NAcc | Nucleus accumbens |
| Pal | Pallidum |
| Pu | Putamen |
| Tha | Thalamus |
| CeB | Cerebellum |
| BStem | Brain stem |
References
- Irimia, Andrei; Chambers, M.C.; Torgerson, C.M.; Van Horn, J.D. (2 April 2012). "Circular representation of human cortical networks for subject and population-level connectomic visualization". NeuroImage. 60 (2): 1340–51. doi:10.1016/j.neuroimage.2012.01.107. PMC 3594415. PMID 22305988.
- Guo, Zhenyang; et al. (January 2013). "National Borders Effectively Halt the Spread of Rabies: The Current Rabies Epidemic in China Is Dislocated from Cases in Neighboring Countries". PLoS Neglected Tropical Diseases. 7 (1): e2039. doi:10.1371/journal.pntd.0002039. PMC 3561166. PMID 23383359.
- Hennemann, Stefan (2013). "Information-rich visualisation of dense geographical networks". Journal of Maps. 9 (1): 1–8. doi:10.1080/17445647.2012.753850.
- Lamere, Paul (2012-11-12). "The Infinite Jukebox". Music Machinery.
- Jetz, W.; G. H. Thomas; J. B. Joy; K. Hartmann; A. O. Mooers (15 November 2012). "The global diversity of birds in space and time". Nature. 491 (7424): 444–448. Bibcode:2012Natur.491..444J. doi:10.1038/nature11631. PMID 23123857.
- Yip, Kevin; et al. (26 September 2012). "Classification of human genomic regions based on experimentally determined binding sites of more than 100 transcription-related factors". Genome Biology. 13 (9): R48. doi:10.1186/gb-2012-13-9-r48. PMC 3491392. PMID 22950945.
- Barbas, Helen (October 2017). Paulo J.S. Goncalves (ed.). VR, AR, MR SIMULATIONS AND INSPIRATIONS FROM "IRON MAN 3" (PDF). European Simulation and Modelling Conference. Retrieved 6 November 2017.
- "Human Connectome Project". NIH.
- "Hard Cell". The Economist. 9 March 2013. Retrieved 11 March 2013.
- "Introduction to Circos, Features and Uses // CIRCOS Circular Genome Data Visualization".
- Krzywinski, M; Schein, J; Birol, I; Connors, J; Gascoyne, R; Horsman, D; Jones, SJ; Marra, MA (28 May 2009). "Circos: an information aesthetic for comparative genomics". Genome Research. 19 (9): 1639–1645. doi:10.1101/gr.092759.109. PMC 2752132. PMID 19541911.
- Irimia, Andrei; Chambers, M.C.; Torgerson, C.M.; Filippou, M.; Hovda, D.A.; Alger, J.R.; Gerig, G.; Toga, A.W.; Vespa, P.M.; Kikinis, R.; Van Horn, J.D. (6 February 2012). "Patient-tailored connectomics visualization for the assessment of white matter atrophy in traumatic brain injury". Frontiers in Neurology. 3: 10. doi:10.3389/fneur.2012.00010. PMC 3275792. PMID 22363313.
- Van Horn, John D.; Irimia, A.; Torgerson, C.M.; Chambers, M.C.; Kikinis, R.; Toga, A.W. (16 May 2012). Sporns, Olaf (ed.). "Mapping connectivity damage in the case of Phineas Gage". PLoS ONE. 7 (5): e37454. Bibcode:2012PLoSO...737454V. doi:10.1371/journal.pone.0037454. PMC 3353935. PMID 22616011.
- Ingalhalikar, Madhura; Alex Smith; Drew Parker; Theodore Satterthwaite; Mark Elliott; Kosha Ruparel; Hakon Hakonarson; Raquel Gur; Ragini Verma (December 2013). "Sex differences in the structural connectome of the human brain". Proceedings of the National Academy of Sciences. 111 (2): 823–8. Bibcode:2014PNAS..111..823I. doi:10.1073/pnas.1316909110. PMC 3896179. PMID 24297904.
- Messé, Arnaud; Sophie Caplain; Mélanie Pélégrini-Issac; Sophie Blancho; Richard Lévy; Nozar Aghakhani; Michèle Montreuil; Habib Benali; Stéphane Lehéricy (6 June 2013). "Specific and Evolving Resting-State Network Alterations in Post-Concussion Syndrome Following Mild Traumatic Brain Injury". PLoS ONE. 8 (6): e65470. Bibcode:2013PLoSO...865470M. doi:10.1371/journal.pone.0065470. PMC 3675039. PMID 23755237.
- Wee, Chong-Yaw; Pew-Thian Yap; Daoqiang Zhang; Lihong Wang; Dinggang Shen (7 March 2013). "Group-constrained sparse fMRI connectivity modeling for mild cognitive impairment identification". Brain Structure & Function. 219 (2): 641–656. doi:10.1007/s00429-013-0524-8. PMC 3710527. PMID 23468090.
- Irimia, Andrei; Jack Van Horn (29 October 2012). "The structural, connectomic, and network covariance of the human brain". NeuroImage. 66: 489–499. doi:10.1016/j.neuroimage.2012.10.066. PMC 3586751. PMID 23116816.
- Pandit, A.S.; Robinson E; Aljabar P; Ball G; Gousias IS; Wang Z; Hajnal JV; Rueckert D; Counsell SJ; Montana G; Edwards AD (31 March 2013). "Whole-Brain Mapping of Structural Connectivity in Infants Reveals Altered Connection Strength Associated with Growth and Preterm Birth". Cerebral Cortex. 24 (9): 2324–2333. doi:10.1093/cercor/bht086. PMID 23547135.
- Sporns, Olaf (2011). Networks of the Brain. MIT Press. ISBN 978-0-262-01469-4.
Further reading
[further 1][further 2][further 3][further 4]
- Petrella, Jeffrey; P. Murali Doraiswamy (9 April 2013). "From the bridges of Königsberg to the fields of Alzheimer". Neurology. 80 (15): 1360–2. doi:10.1212/WNL.0b013e31828c3062. PMID 23486887.
- Craddock, R Cameron; Saad Jbabdi; Chao-Gan Yan; Joshua T Vogelstein; F Xavier Castellanos; Adriana Di Martino; Clare Kelly; Keith Heberlein; Stan Colcombe; Michael P Milham (June 2013). "Imaging human connectomes at the macroscale". Nature Methods. 10 (6): 524–39. doi:10.1038/nmeth.2482. PMC 4096321. PMID 23722212.
- Margulies, Daniel; Joachim Böttger; Aimi Watanabe; Krzysztof J. Gorgolewski (15 October 2013). "Visualizing the human connectome". NeuroImage. 80: 445–61. doi:10.1016/j.neuroimage.2013.04.111. PMID 23660027.
- Karunakaran, Suganya; Matthew J. Rollo; Kamin Kim; Jessica A. Johnson; Gridhar P. Kalamangalam; Behnaam Aazhang; Nitin Tandon (5 December 2017). "The interictal mesial temporal lobe epilepsy network". Epilepsia. 59 (1): 244–258. doi:10.1111/epi.13959. PMID 29210066.