Graph theory
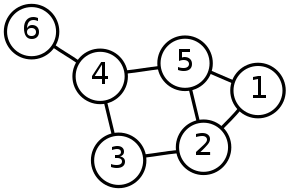
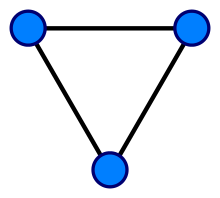
In mathematics, graph theory is the study of graphs, which are mathematical structures used to model pairwise relations between objects. A graph in this context is made up of vertices (also called nodes or points) which are connected by edges (also called links or lines). A distinction is made between undirected graphs, where edges link two vertices symmetrically, and directed graphs, where edges link two vertices asymmetrically; see Graph (discrete mathematics) for more detailed definitions and for other variations in the types of graph that are commonly considered. Graphs are one of the prime objects of study in discrete mathematics.
Refer to the glossary of graph theory for basic definitions in graph theory.
Definitions
Definitions in graph theory vary. The following are some of the more basic ways of defining graphs and related mathematical structures.
Graph
In one restricted but very common sense of the term,[1][2] a graph is an ordered pair G = (V, E) comprising:
- V a set of vertices (also called nodes or points);
- E ⊆ {{x, y} | (x, y) ∈ V2 ∧ x ≠ y} a set of edges (also called links or lines), which are unordered pairs of vertices (that is, an edge is associated with two distinct vertices).
To avoid ambiguity, this type of object may be called precisely an undirected simple graph.
In the edge {x, y}, the vertices x and y are called the endpoints of the edge. The edge is said to join x and y and to be incident on x and on y. A vertex may exist in a graph and not belong to an edge. Multiple edges are two or more edges that join the same two vertices.
In one more general sense of the term allowing multiple edges,[3][4] a graph is an ordered triple G = (V, E, ϕ) comprising:
- V a set of vertices (also called nodes or points);
- E a set of edges (also called links or lines);
- ϕ: E → {{x, y} | (x, y) ∈ V2 ∧ x ≠ y} an incidence function mapping every edge to an unordered pair of vertices (that is, an edge is associated with two distinct vertices).
To avoid ambiguity, this type of object may be called precisely an undirected multigraph.
A loop is an edge that joins a vertex to itself. Graphs as defined in the two definitions above cannot have loops, because a loop joining a vertex x is the edge (for an undirected simple graph) or is incident on (for an undirected multigraph) {x, x} = {x} which is not in {{x, y} | (x, y) ∈ V2 ∧ x ≠ y}. So to allow loops the definitions must be expanded. For undirected simple graphs, E ⊆ {{x, y} | (x, y) ∈ V2 ∧ x ≠ y} should become E ⊆ {{x, y} | (x, y) ∈ V2}. For undirected multigraphs, ϕ: E → {{x, y} | (x, y) ∈ V2 ∧ x ≠ y} should become ϕ: E → {{x, y} | (x, y) ∈ V2}. To avoid ambiguity, these types of objects may be called precisely an undirected simple graph permitting loops and an undirected multigraph permitting loops respectively.
V and E are usually taken to be finite, and many of the well-known results are not true (or are rather different) for infinite graphs because many of the arguments fail in the infinite case. Moreover, V is often assumed to be non-empty, but E is allowed to be the empty set. The order of a graph is |V|, its number of vertices. The size of a graph is |E|, its number of edges. The degree or valency of a vertex is the number of edges that are incident to it, where a loop is counted twice.
In an undirected simple graph of order n, the maximum degree of each vertex is n − 1 and the maximum size of the graph is n(n − 1)/2.
The edges of an undirected simple graph permitting loops G induce a symmetric homogeneous relation ~ on the vertices of G that is called the adjacency relation of G. Specifically, for each edge {x, y}, its endpoints x and y are said to be adjacent to one another, which is denoted x ~ y.
Directed graph
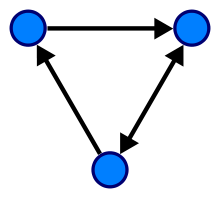
A directed graph or digraph is a graph in which edges have orientations.
In one restricted but very common sense of the term,[5] a directed graph is an ordered pair G = (V, E) comprising:
- V a set of vertices (also called nodes or points);
- E ⊆ {(x, y) | (x, y) ∈ V2 ∧ x ≠ y} a set of edges (also called directed edges, directed links, directed lines, arrows or arcs) which are ordered pairs of distinct vertices (i.e., an edge is associated with two distinct vertices).
To avoid ambiguity, this type of object may be called precisely a directed simple graph.
In the edge (x, y) directed from x to y, the vertices x and y are called the endpoints of the edge, x the tail of the edge and y the head of the edge. The edge (y, x) is called the inverted edge of (x, y). The edge is said to join x and y and to be incident on x and on y. A vertex may exist in a graph and not belong to an edge. Multiple edges are two or more edges with both the same tail and the same head.
In one more general sense of the term allowing multiple edges,[5] a directed graph is an ordered triple G = (V, E, ϕ) comprising:
- V a set of vertices (also called nodes or points);
- E a set of edges (also called directed edges, directed links, directed lines, arrows or arcs);
- ϕ: E → {(x, y) | (x, y) ∈ V2 ∧ x ≠ y} an incidence function mapping every edge to an ordered pair of distinct vertices (i.e., an edge is associated with two distinct vertices).
To avoid ambiguity, this type of object may be called precisely a directed multigraph.
A loop is an edge that joins a vertex to itself. Directed graphs as defined in the two definitions above cannot have loops, because a loop joining a vertex x is the edge (for a directed simple graph) or is incident on (for a directed multigraph) (x, x) which is not in {(x, y) | (x, y) ∈ V2 ∧ x ≠ y}. So to allow loops the definitions must be expanded. For directed simple graphs, E ⊆ {(x, y) | (x, y) ∈ V2 ∧ x ≠ y} should become E ⊆ {(x, y) | (x, y) ∈ V2}. For directed multigraphs, ϕ: E → {(x, y) | (x, y) ∈ V2 ∧ x ≠ y} should become ϕ: E → {(x, y) | (x, y) ∈ V2}. To avoid ambiguity, these types of objects may be called precisely a directed simple graph permitting loops and a directed multigraph permitting loops (or a quiver) respectively.
The edges of a directed simple graph permitting loops G is a homogeneous relation ~ on the vertices of G that is called the adjacency relation of G. Specifically, for each edge (x, y), its endpoints x and y are said to be adjacent to one another, which is denoted x ~ y.
Applications
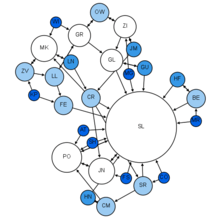
Graphs are mathematical abstractions that can be used to represent networks of various types: physical (e.g., the internet or electrical networks), biological (e.g., brain networks), or social (e.g., online social networks). Furthermore, graphs can provide tools for flexible representation of data sets in which data points have irregular positions with respect to each other. Common examples of this include data sets acquired by a sensor network, where uniform sensor placement may not be possible, or machine learning data sets, where training samples are not uniformly distributed in feature space. In some instances, a graph representation arises as a natural way to describe the problem, while in other areas, e.g., image processing, they are being used to develop powerful, content-dependent alternatives to conventional processing tools.[7]
In fact, many practical problems can be represented by graphs. Emphasizing their application to real-world systems, the term network is sometimes defined to mean a graph in which attributes (e.g. names) are associated with the vertices and edges, and the subject that expresses and understands the real-world systems as a network is called network science.
Computer science
In computer science, graphs are used to represent networks of communication, data organization, computational devices, the flow of computation, etc. Graph theory can be used in research areas such as data mining, image segmentation, clustering, image capturing, networking etc. Problems of efficiently planning routes for mail delivery, fault diagnostic in computer network and planning a LAN using efficient network topology can be done using graphs.[8] For instance, the link structure of a website can be represented by a directed graph, in which the vertices represent web pages and directed edges represent links from one page to another. A similar approach can be taken to problems in social media,[9] travel, biology, computer chip design, mapping the progression of neuro-degenerative diseases,[10][11] and many other fields. The development of algorithms to handle graphs is therefore of major interest in computer science. The transformation of graphs is often formalized and represented by graph rewrite systems. Complementary to graph transformation systems focusing on rule-based in-memory manipulation of graphs are graph databases geared towards transaction-safe, persistent storing and querying of graph-structured data.
Linguistics
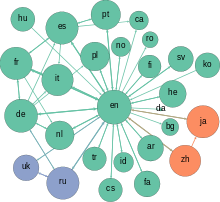
Graph-theoretic methods, in various forms, have proven particularly useful in linguistics, since natural language often lends itself well to discrete structure. Traditionally, syntax and compositional semantics follow tree-based structures, whose expressive power lies in the principle of compositionality, modeled in a hierarchical graph. More contemporary approaches such as head-driven phrase structure grammar model the syntax of natural language using typed feature structures, which are directed acyclic graphs. Within lexical semantics, especially as applied to computers, modeling word meaning is easier when a given word is understood in terms of related words; semantic networks are therefore important in computational linguistics. Still, other methods in phonology (e.g. optimality theory, which uses lattice graphs) and morphology (e.g. finite-state morphology, using finite-state transducers) are common in the analysis of language as a graph. Indeed, the usefulness of this area of mathematics to linguistics has borne organizations such as TextGraphs, as well as various 'Net' projects, such as WordNet, VerbNet, and others.
Physics and chemistry
Graph theory is also used to study molecules in chemistry and physics. In condensed matter physics, the three-dimensional structure of complicated simulated atomic structures can be studied quantitatively by gathering statistics on graph-theoretic properties related to the topology of the atoms. Also, "the Feynman graphs and rules of calculation summarize quantum field theory in a form in close contact with the experimental numbers one wants to understand."[12] In chemistry a graph makes a natural model for a molecule, where vertices represent atoms and edges bonds. This approach is especially used in computer processing of molecular structures, ranging from chemical editors to database searching. In statistical physics, graphs can represent local connections between interacting parts of a system, as well as the dynamics of a physical process on such systems. Graph theory plays an important role in electrical modeling of electrical networks, here, weights are associated with resistance of the wire segments to obtain electrical properties of network structures.[13] Graphs are also used to represent the micro-scale channels of porous media, in which the vertices represent the pores and the edges represent the smaller channels connecting the pores. Chemical graph theory uses the molecular graph as a means to model molecules. Graphs and networks are excellent models to study and understand phase transitions and critical phenomena. Removal of nodes or edges lead to a critical transition where the network breaks into small clusters which is studied as a phase transition. This breakdown is studied via percolation theory.[14] [15]
In computational biochemistry some sequences of cell samples have to be excluded to resolve the conflicts between two sequences. This is modeled in the form of graph where the vertices represent the sequences in the sample. An edge will be drawn between two vertices if and only if there is a conflict between the corresponding sequences. The aim is to remove possible vertices, (sequences) to eliminate all conflicts.[16]
Biology
Likewise, graph theory is useful in biology and conservation efforts where a vertex can represent regions where certain species exist (or inhabit) and the edges represent migration paths or movement between the regions. This information is important when looking at breeding patterns or tracking the spread of disease, parasites or how changes to the movement can affect other species.
Graphs are also commonly used in molecular biology and genomics to model and analyse datasets with complex relationships. For example, graph-based methods are often used to 'cluster' cells together into cell-types in single-cell transcriptome analysis. Another use is to model genes or proteins in a pathway and study the relationships between them, such as metabolic pathways and gene regulatory networks.[17] Evolutionary trees, ecological networks, and hierarchical clustering of gene expression patterns are also represented as graph structures. Graph-based methods are pervasive that researchers in some fields of biology and these will only become far more widespread as technology develops to leverage this kind of high-throughout multidimensional data.
Graph theory is also used in connectomics;[18] nervous systems can be seen as a graph, where the nodes are neurons and the edges are the connections between them.
Neuroscience
In computational neuroscience graph theory methods can offer important new insights into the structure and function of networked brain systems, including their architecture, evolution, development, and clinical disorders.[19] Graphs can be used to represent functional connections between brain areas that interact to give rise to various cognitive processes, where the vertices represent different areas of the brain and the edges represent the connections between those areas. Graph theoretical metrics such as node degree, clustering coefficient, average path length, hubs, centrality, modularity, robustness, and assortativity can be utilized to detect the topological patterns of brain networks and reflect cognitive and behavioral performances.[20][21] Typically, one cannot claim which measures are more suitable for studying the brain network,[22] but given the complex structure of the human brain, measures that can represent the small-world properties of the brain network are of great importance. This critical property arises with the help of hubs (i.e., highly connected nodes in a network), causing the creation of local clusters.[23]
Graph theory is also used to investigate common neurological disorders, comprising epilepsy, Alzheimer's disease (AD), multiple sclerosis (MS), autism spectrum disorder (ASD), and attention-deficit/hyperactivity disorder (ADHD).[24] Other mental disorders were also found in recent graph-based literature, including schizophrenia, Parkinson's disease, insomnia, major depression, obsessive compulsive disorder (OCD), borderline personality disorder (BPD), and bipolar disorder.[25][26]
Social sciences
Graph theory is also widely used in sociology as a way, for example, to measure actors' prestige or to explore rumor spreading, notably through the use of social network analysis software. In sociological applications, the nodes are typically individuals, roles, or organizations, and the links are social relationships (such as kinship, friendship, communication, or authority). The links may take account of direction (a digraph) or ignore it (an undirected graph) and they may be at any level of measurement. Under the umbrella of social networks are many different types of graphs.[28] Acquaintanceship and friendship graphs describe whether people know each other. Influence graphs model whether certain people can influence the behavior of others. Finally, collaboration graphs model whether two people work together in a particular way, such as acting in a movie together.
Mathematics
In mathematics, graphs are useful in geometry and certain parts of topology such as knot theory. Algebraic graph theory has close links with group theory. Algebraic graph theory has been applied to many areas including dynamic systems and complexity.
Other topics
A graph structure can be extended by assigning a weight to each edge of the graph. Graphs with weights, or weighted graphs, are used to represent structures in which pairwise connections have some numerical values. For example, if a graph represents a road network, the weights could represent the length of each road. There may be several weights associated with each edge, including distance (as in the previous example), travel time, or monetary cost. Such weighted graphs are commonly used to program GPS's, and travel-planning search engines that compare flight times and costs.
History
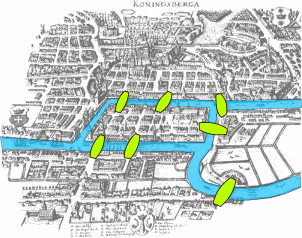
The paper written by Leonhard Euler on the Seven Bridges of Königsberg and published in 1736 is regarded as the first paper in the history of graph theory.[29] This paper, as well as the one written by Vandermonde on the knight problem, carried on with the analysis situs initiated by Leibniz. Euler's formula relating the number of edges, vertices, and faces of a convex polyhedron was studied and generalized by Cauchy[30] and L'Huilier,[31] and represents the beginning of the branch of mathematics known as topology.
More than one century after Euler's paper on the bridges of Königsberg and while Listing was introducing the concept of topology, Cayley was led by an interest in particular analytical forms arising from differential calculus to study a particular class of graphs, the trees.[32] This study had many implications for theoretical chemistry. The techniques he used mainly concern the enumeration of graphs with particular properties. Enumerative graph theory then arose from the results of Cayley and the fundamental results published by Pólya between 1935 and 1937. These were generalized by De Bruijn in 1959. Cayley linked his results on trees with contemporary studies of chemical composition.[33] The fusion of ideas from mathematics with those from chemistry began what has become part of the standard terminology of graph theory.
In particular, the term "graph" was introduced by Sylvester in a paper published in 1878 in Nature, where he draws an analogy between "quantic invariants" and "co-variants" of algebra and molecular diagrams:[34]
- "[…] Every invariant and co-variant thus becomes expressible by a graph precisely identical with a Kekuléan diagram or chemicograph. […] I give a rule for the geometrical multiplication of graphs, i.e. for constructing a graph to the product of in- or co-variants whose separate graphs are given. […]" (italics as in the original).
The first textbook on graph theory was written by Dénes Kőnig, and published in 1936.[35] Another book by Frank Harary, published in 1969, was "considered the world over to be the definitive textbook on the subject",[36] and enabled mathematicians, chemists, electrical engineers and social scientists to talk to each other. Harary donated all of the royalties to fund the Pólya Prize.[37]
One of the most famous and stimulating problems in graph theory is the four color problem: "Is it true that any map drawn in the plane may have its regions colored with four colors, in such a way that any two regions having a common border have different colors?" This problem was first posed by Francis Guthrie in 1852 and its first written record is in a letter of De Morgan addressed to Hamilton the same year. Many incorrect proofs have been proposed, including those by Cayley, Kempe, and others. The study and the generalization of this problem by Tait, Heawood, Ramsey and Hadwiger led to the study of the colorings of the graphs embedded on surfaces with arbitrary genus. Tait's reformulation generated a new class of problems, the factorization problems, particularly studied by Petersen and Kőnig. The works of Ramsey on colorations and more specially the results obtained by Turán in 1941 was at the origin of another branch of graph theory, extremal graph theory.
The four color problem remained unsolved for more than a century. In 1969 Heinrich Heesch published a method for solving the problem using computers.[38] A computer-aided proof produced in 1976 by Kenneth Appel and Wolfgang Haken makes fundamental use of the notion of "discharging" developed by Heesch.[39][40] The proof involved checking the properties of 1,936 configurations by computer, and was not fully accepted at the time due to its complexity. A simpler proof considering only 633 configurations was given twenty years later by Robertson, Seymour, Sanders and Thomas.[41]
The autonomous development of topology from 1860 and 1930 fertilized graph theory back through the works of Jordan, Kuratowski and Whitney. Another important factor of common development of graph theory and topology came from the use of the techniques of modern algebra. The first example of such a use comes from the work of the physicist Gustav Kirchhoff, who published in 1845 his Kirchhoff's circuit laws for calculating the voltage and current in electric circuits.
The introduction of probabilistic methods in graph theory, especially in the study of Erdős and Rényi of the asymptotic probability of graph connectivity, gave rise to yet another branch, known as random graph theory, which has been a fruitful source of graph-theoretic results.
Graph drawing
Graphs are represented visually by drawing a point or circle for every vertex, and drawing a line between two vertices if they are connected by an edge. If the graph is directed, the direction is indicated by drawing an arrow.
A graph drawing should not be confused with the graph itself (the abstract, non-visual structure) as there are several ways to structure the graph drawing. All that matters is which vertices are connected to which others by how many edges and not the exact layout. In practice, it is often difficult to decide if two drawings represent the same graph. Depending on the problem domain some layouts may be better suited and easier to understand than others.
The pioneering work of W. T. Tutte was very influential on the subject of graph drawing. Among other achievements, he introduced the use of linear algebraic methods to obtain graph drawings.
Graph drawing also can be said to encompass problems that deal with the crossing number and its various generalizations. The crossing number of a graph is the minimum number of intersections between edges that a drawing of the graph in the plane must contain. For a planar graph, the crossing number is zero by definition.
Drawings on surfaces other than the plane are also studied.
Graph-theoretic data structures
There are different ways to store graphs in a computer system. The data structure used depends on both the graph structure and the algorithm used for manipulating the graph. Theoretically one can distinguish between list and matrix structures but in concrete applications the best structure is often a combination of both. List structures are often preferred for sparse graphs as they have smaller memory requirements. Matrix structures on the other hand provide faster access for some applications but can consume huge amounts of memory. Implementations of sparse matrix structures that are efficient on modern parallel computer architectures are an object of current investigation.[42]
List structures include the incidence list, an array of pairs of vertices, and the adjacency list, which separately lists the neighbors of each vertex: Much like the incidence list, each vertex has a list of which vertices it is adjacent to.
Matrix structures include the incidence matrix, a matrix of 0's and 1's whose rows represent vertices and whose columns represent edges, and the adjacency matrix, in which both the rows and columns are indexed by vertices. In both cases a 1 indicates two adjacent objects and a 0 indicates two non-adjacent objects. The degree matrix indicates the degree of vertices. The Laplacian matrix is a modified form of the adjacency matrix that incorporates information about the degrees of the vertices, and is useful in some calculations such as Kirchhoff's theorem on the number of spanning trees of a graph. The distance matrix, like the adjacency matrix, has both its rows and columns indexed by vertices, but rather than containing a 0 or a 1 in each cell it contains the length of a shortest path between two vertices.
Problems
Enumeration
There is a large literature on graphical enumeration: the problem of counting graphs meeting specified conditions. Some of this work is found in Harary and Palmer (1973).
Subgraphs, induced subgraphs, and minors
A common problem, called the subgraph isomorphism problem, is finding a fixed graph as a subgraph in a given graph. One reason to be interested in such a question is that many graph properties are hereditary for subgraphs, which means that a graph has the property if and only if all subgraphs have it too. Unfortunately, finding maximal subgraphs of a certain kind is often an NP-complete problem. For example:
- Finding the largest complete subgraph is called the clique problem (NP-complete).
One special case of subgraph isomorphism is the graph isomorphism problem. It asks whether two graphs are isomorphic. It is not known whether this problem is NP-complete, nor whether it can be solved in polynomial time.
A similar problem is finding induced subgraphs in a given graph. Again, some important graph properties are hereditary with respect to induced subgraphs, which means that a graph has a property if and only if all induced subgraphs also have it. Finding maximal induced subgraphs of a certain kind is also often NP-complete. For example:
- Finding the largest edgeless induced subgraph or independent set is called the independent set problem (NP-complete).
Still another such problem, the minor containment problem, is to find a fixed graph as a minor of a given graph. A minor or subcontraction of a graph is any graph obtained by taking a subgraph and contracting some (or no) edges. Many graph properties are hereditary for minors, which means that a graph has a property if and only if all minors have it too. For example, Wagner's Theorem states:
- A graph is planar if it contains as a minor neither the complete bipartite graph K3,3 (see the Three-cottage problem) nor the complete graph K5.
A similar problem, the subdivision containment problem, is to find a fixed graph as a subdivision of a given graph. A subdivision or homeomorphism of a graph is any graph obtained by subdividing some (or no) edges. Subdivision containment is related to graph properties such as planarity. For example, Kuratowski's Theorem states:
- A graph is planar if it contains as a subdivision neither the complete bipartite graph K3,3 nor the complete graph K5.
Another problem in subdivision containment is the Kelmans–Seymour conjecture:
- Every 5-vertex-connected graph that is not planar contains a subdivision of the 5-vertex complete graph K5.
Another class of problems has to do with the extent to which various species and generalizations of graphs are determined by their point-deleted subgraphs. For example:
Graph coloring
Many problems and theorems in graph theory have to do with various ways of coloring graphs. Typically, one is interested in coloring a graph so that no two adjacent vertices have the same color, or with other similar restrictions. One may also consider coloring edges (possibly so that no two coincident edges are the same color), or other variations. Among the famous results and conjectures concerning graph coloring are the following:
- Four-color theorem
- Strong perfect graph theorem
- Erdős–Faber–Lovász conjecture (unsolved)
- Total coloring conjecture, also called Behzad's conjecture (unsolved)
- List coloring conjecture (unsolved)
- Hadwiger conjecture (graph theory) (unsolved)
Subsumption and unification
Constraint modeling theories concern families of directed graphs related by a partial order. In these applications, graphs are ordered by specificity, meaning that more constrained graphs—which are more specific and thus contain a greater amount of information—are subsumed by those that are more general. Operations between graphs include evaluating the direction of a subsumption relationship between two graphs, if any, and computing graph unification. The unification of two argument graphs is defined as the most general graph (or the computation thereof) that is consistent with (i.e. contains all of the information in) the inputs, if such a graph exists; efficient unification algorithms are known.
For constraint frameworks which are strictly compositional, graph unification is the sufficient satisfiability and combination function. Well-known applications include automatic theorem proving and modeling the elaboration of linguistic structure.
Route problems
- Hamiltonian path problem
- Minimum spanning tree
- Route inspection problem (also called the "Chinese postman problem")
- Seven bridges of Königsberg
- Shortest path problem
- Steiner tree
- Three-cottage problem
- Traveling salesman problem (NP-hard)
Network flow
There are numerous problems arising especially from applications that have to do with various notions of flows in networks, for example:
- Max flow min cut theorem
Visibility problems
- Museum guard problem
Covering problems
Covering problems in graphs may refer to various set cover problems on subsets of vertices/subgraphs.
- Dominating set problem is the special case of set cover problem where sets are the closed neighborhoods.
- Vertex cover problem is the special case of Set cover problem where sets to cover are every edges.
- The original set cover problem, also called hitting set, can be described as a vertex cover in a hypergraph.
Decomposition problems
Decomposition, defined as partitioning the edge set of a graph (with as many vertices as necessary accompanying the edges of each part of the partition), has a wide variety of question. Often, it is required to decompose a graph into subgraphs isomorphic to a fixed graph; for instance, decomposing a complete graph into Hamiltonian cycles. Other problems specify a family of graphs into which a given graph should be decomposed, for instance, a family of cycles, or decomposing a complete graph Kn into n − 1 specified trees having, respectively, 1, 2, 3, ..., n − 1 edges.
Some specific decomposition problems that have been studied include:
- Arboricity, a decomposition into as few forests as possible
- Cycle double cover, a decomposition into a collection of cycles covering each edge exactly twice
- Edge coloring, a decomposition into as few matchings as possible
- Graph factorization, a decomposition of a regular graph into regular subgraphs of given degrees
Graph classes
Many problems involve characterizing the members of various classes of graphs. Some examples of such questions are below:
- Enumerating the members of a class
- Characterizing a class in terms of forbidden substructures
- Ascertaining relationships among classes (e.g. does one property of graphs imply another)
- Finding efficient algorithms to decide membership in a class
- Finding representations for members of a class
See also
- Gallery of named graphs
- Glossary of graph theory
- List of graph theory topics
- List of unsolved problems in graph theory
- Publications in graph theory
Related topics
- Algebraic graph theory
- Citation graph
- Conceptual graph
- Data structure
- Disjoint-set data structure
- Dual-phase evolution
- Entitative graph
- Existential graph
- Graph algebra
- Graph automorphism
- Graph coloring
- Graph database
- Graph data structure
- Graph drawing
- Graph equation
- Graph rewriting
- Graph sandwich problem
- Graph property
- Intersection graph
- Knight's Tour
- Logical graph
- Loop
- Network theory
- Null graph
- Pebble motion problems
- Percolation
- Perfect graph
- Quantum graph
- Random regular graphs
- Semantic networks
- Spectral graph theory
- Strongly regular graphs
- Symmetric graphs
- Transitive reduction
- Tree data structure
Algorithms
- Bellman–Ford algorithm
- Borůvka's algorithm
- Breadth-first search
- Depth-first search
- Dijkstra's algorithm
- Edmonds–Karp algorithm
- Floyd–Warshall algorithm
- Ford–Fulkerson algorithm
- Hopcroft–Karp algorithm
- Hungarian algorithm
- Kosaraju's algorithm
- Kruskal's algorithm
- Nearest neighbour algorithm
- Network simplex algorithm
- Planarity testing algorithms
- Prim's algorithm
- Push–relabel maximum flow algorithm
- Tarjan's strongly connected components algorithm
- Topological sorting
Subareas
Related areas of mathematics
Generalizations
Prominent graph theorists
- Alon, Noga
- Berge, Claude
- Bollobás, Béla
- Bondy, Adrian John
- Brightwell, Graham
- Chudnovsky, Maria
- Chung, Fan
- Dirac, Gabriel Andrew
- Erdős, Paul
- Euler, Leonhard
- Faudree, Ralph
- Fleischner, Herbert
- Golumbic, Martin
- Graham, Ronald
- Harary, Frank
- Heawood, Percy John
- Kotzig, Anton
- Kőnig, Dénes
- Lovász, László
- Murty, U. S. R.
- Nešetřil, Jaroslav
- Rényi, Alfréd
- Ringel, Gerhard
- Robertson, Neil
- Seymour, Paul
- Sudakov, Benny
- Szemerédi, Endre
- Thomas, Robin
- Thomassen, Carsten
- Turán, Pál
- Tutte, W. T.
- Whitney, Hassler
Notes
- Bender & Williamson 2010, p. 148.
- See, for instance, Iyanaga and Kawada, 69 J, p. 234 or Biggs, p. 4.
- Bender & Williamson 2010, p. 149.
- See, for instance, Graham et al., p. 5.
- Bender & Williamson 2010, p. 161.
- Hale, Scott A. (2013). "Multilinguals and Wikipedia Editing". Proceedings of the 2014 ACM Conference on Web Science - WebSci '14: 99–108. arXiv:1312.0976. Bibcode:2013arXiv1312.0976H. doi:10.1145/2615569.2615684. ISBN 9781450326223.
- Adali, Tulay; Ortega, Antonio (May 2018). "Applications of Graph Theory [Scanning the Issue]". Proceedings of the IEEE. 106 (5): 784–786. doi:10.1109/JPROC.2018.2820300. ISSN 0018-9219.
- Riaz, Ferozuddin; Ali, Khidir M. (July 2011). "Applications of Graph Theory in Computer Science". 2011 Third International Conference on Computational Intelligence, Communication Systems and Networks. IEEE. doi:10.1109/cicsyn.2011.40. ISBN 978-1-4577-0975-3.
- Grandjean, Martin (2016). "A social network analysis of Twitter: Mapping the digital humanities community" (PDF). Cogent Arts & Humanities. 3 (1): 1171458. doi:10.1080/23311983.2016.1171458.
- Vecchio, F (2017). ""Small World" architecture in brain connectivity and hippocampal volume in Alzheimer's disease: a study via graph theory from EEG data". Brain Imaging and Behavior. 11 (2): 473–485. doi:10.1007/s11682-016-9528-3. PMID 26960946.
- Vecchio, F (2013). "Brain network connectivity assessed using graph theory in frontotemporal dementia". Neurology. 81 (2): 134–143. doi:10.1212/WNL.0b013e31829a33f8. PMID 23719145.
- Bjorken, J. D.; Drell, S. D. (1965). Relativistic Quantum Fields. New York: McGraw-Hill. p. viii.
- Kumar, Ankush; Kulkarni, G. U. (2016-01-04). "Evaluating conducting network based transparent electrodes from geometrical considerations". Journal of Applied Physics. 119 (1): 015102. Bibcode:2016JAP...119a5102K. doi:10.1063/1.4939280. ISSN 0021-8979.
- Newman, Mark (2010). Networks: An Introduction (PDF). Oxford University Press.
- Reuven Cohen, Shlomo Havlin (2010). Complex Networks: Structure, Robustness and Function Cambridge University Press.
- International Journal of Engineering Technology and Management Sciences. International Journal of Engineering Technology and Management Sciences.
- Kelly, S Thomas; Black, Michael A (2 March 2020). "graphsim: An R package for simulating gene expression data from graph structures of biological pathways". bioRxiv. 2020.03.02.972471. doi:10.1101/2020.03.02.972471. Retrieved 27 May 2020.
- Shah, Preya; Ashourvan, Arian; Mikhail, Fadi; Pines, Adam; Kini, Lohith; Oechsel, Kelly; Das, Sandhitsu R; Stein, Joel M; Shinohara, Russell T (2019-07-01). "Characterizing the role of the structural connectome in seizure dynamics". Brain. 142 (7): 1955–1972. doi:10.1093/brain/awz125. ISSN 0006-8950.
- Kötter, R. (Rolf) (2003). Neuroscience Databases : a Practical Guide. Boston, MA: Springer US. ISBN 978-1-4615-1079-6. OCLC 840283587.
- Parker, Charles Thomas; Taylor, Dorothea; Garrity, George M (2003-01-01). "Exemplar Abstract for Paraburkholderia calva (Van Oevelen et al. 2004) Sawana et al. 2014 and Burkholderia calva Van Oevelen et al. 2004". The NamesforLife Abstracts. Retrieved 2020-06-23.
- Farahani, Farzad V.; Karwowski, Waldemar; Lighthall, Nichole R. (2019-06-06). "Application of Graph Theory for Identifying Connectivity Patterns in Human Brain Networks: A Systematic Review". Frontiers in Neuroscience. 13: 585. doi:10.3389/fnins.2019.00585. ISSN 1662-453X. PMC 6582769. PMID 31249501.
- Bullmore, Ed; Sporns, Olaf (2009-03-04). "Erratum: Complex brain networks: graph theoretical analysis of structural and functional systems". Nature Reviews Neuroscience. 10 (4): 312–312. doi:10.1038/nrn2618. ISSN 1471-003X.
- Farahani, Farzad V.; Karwowski, Waldemar; Lighthall, Nichole R. (2019-06-06). "Application of Graph Theory for Identifying Connectivity Patterns in Human Brain Networks: A Systematic Review". Frontiers in Neuroscience. 13: 585. doi:10.3389/fnins.2019.00585. ISSN 1662-453X. PMC 6582769. PMID 31249501.
- Farahani, Farzad V.; Karwowski, Waldemar; Lighthall, Nichole R. (2019-06-06). "Application of Graph Theory for Identifying Connectivity Patterns in Human Brain Networks: A Systematic Review". Frontiers in Neuroscience. 13: 585. doi:10.3389/fnins.2019.00585. ISSN 1662-453X. PMC 6582769. PMID 31249501.
- Parker, Charles Thomas; Taylor, Dorothea; Garrity, George M (2003-01-01). "Exemplar Abstract for Mycobacterium abscessus massiliense (Adékambi et al. 2006) Tortoli et al. 2016 emend. Nouioui et al. 2018, Mycobacterium massiliense Adékambi et al. 2006, Mycobacteroides abscessus massiliense (Adékambi et al. 2006) Gupta et al. 2018 and Mycobacterium abscessus bolletii (Adékambi et al. 2006) Leao et al. 2011 emend. Nouioui et al. 2018". The NamesforLife Abstracts. Retrieved 2020-06-23.
- Farahani, Farzad V.; Karwowski, Waldemar; Lighthall, Nichole R. (2019-06-06). "Application of Graph Theory for Identifying Connectivity Patterns in Human Brain Networks: A Systematic Review". Frontiers in Neuroscience. 13: 585. doi:10.3389/fnins.2019.00585. ISSN 1662-453X. PMC 6582769. PMID 31249501.
- Grandjean, Martin (2015). "Social network analysis and visualization: Moreno’s Sociograms revisited". Redesigned network strictly based on Moreno (1934), Who Shall Survive.
- Rosen, Kenneth H. (2011-06-14). Discrete mathematics and its applications (7th ed.). New York: McGraw-Hill. ISBN 978-0-07-338309-5.
- Biggs, N.; Lloyd, E.; Wilson, R. (1986), Graph Theory, 1736-1936, Oxford University Press
- Cauchy, A. L. (1813), "Recherche sur les polyèdres - premier mémoire", Journal de l'École Polytechnique, 9 (Cahier 16): 66–86.
- L'Huillier, S.-A.-J. (1812–1813), "Mémoire sur la polyèdrométrie", Annales de Mathématiques, 3: 169–189.
- Cayley, A. (1857), "On the theory of the analytical forms called trees", Philosophical Magazine, Series IV, 13 (85): 172–176, doi:10.1017/CBO9780511703690.046, ISBN 9780511703690
- Cayley, A. (1875), "Ueber die Analytischen Figuren, welche in der Mathematik Bäume genannt werden und ihre Anwendung auf die Theorie chemischer Verbindungen", Berichte der Deutschen Chemischen Gesellschaft, 8 (2): 1056–1059, doi:10.1002/cber.18750080252.
- Sylvester, James Joseph (1878). "Chemistry and Algebra". Nature. 17 (432): 284. Bibcode:1878Natur..17..284S. doi:10.1038/017284a0.
- Tutte, W.T. (2001), Graph Theory, Cambridge University Press, p. 30, ISBN 978-0-521-79489-3, retrieved 2016-03-14
- Gardner, Martin (1992), Fractal Music, Hypercards, and more…Mathematical Recreations from Scientific American, W. H. Freeman and Company, p. 203
- Society for Industrial and Applied Mathematics (2002), "The George Polya Prize", Looking Back, Looking Ahead: A SIAM History (PDF), p. 26, retrieved 2016-03-14
- Heinrich Heesch: Untersuchungen zum Vierfarbenproblem. Mannheim: Bibliographisches Institut 1969.
- Appel, K.; Haken, W. (1977), "Every planar map is four colorable. Part I. Discharging", Illinois J. Math., 21 (3): 429–490, doi:10.1215/ijm/1256049011.
- Appel, K.; Haken, W. (1977), "Every planar map is four colorable. Part II. Reducibility", Illinois J. Math., 21 (3): 491–567, doi:10.1215/ijm/1256049012.
- Robertson, N.; Sanders, D.; Seymour, P.; Thomas, R. (1997), "The four color theorem", Journal of Combinatorial Theory, Series B, 70: 2–44, doi:10.1006/jctb.1997.1750.
- Kepner, Jeremy; Gilbert, John (2011). Graph Algorithms in the Language of Linear Algebra. SIAM. p. 1171458. ISBN 978-0-898719-90-1.
References
- Bender, Edward A.; Williamson, S. Gill (2010). Lists, Decisions and Graphs. With an Introduction to Probability.
- Claude, Claude (1958). Théorie des graphes et ses applications. Paris: Dunod. English edition, Wiley 1961; Methuen & Co, New York 1962; Russian, Moscow 1961; Spanish, Mexico 1962; Roumanian, Bucharest 1969; Chinese, Shanghai 1963; Second printing of the 1962 first English edition, Dover, New York 2001.
- Biggs, N.; Lloyd, E.; Wilson, R. (1986). Graph Theory, 1736–1936. Oxford University Press.
- Bondy, J. A.; Murty, U. S. R. (2008). Graph Theory. Springer. ISBN 978-1-84628-969-9.
- Bollobás, Béla; Riordan, O. M. (2003). Mathematical results on scale-free random graphs in "Handbook of Graphs and Networks" (S. Bornholdt and H.G. Schuster (eds)) (1st ed.). Weinheim: Wiley VCH.
- Chartrand, Gary (1985). Introductory Graph Theory. Dover. ISBN 0-486-24775-9.
- Deo, Narsingh (1974). Graph Theory with Applications to Engineering and Computer Science (PDF). Englewood, New Jersey: Prentice-Hall. ISBN 0-13-363473-6.
- Gibbons, Alan (1985). Algorithmic Graph Theory. Cambridge University Press.
- Reuven Cohen, Shlomo Havlin (2010). Complex Networks: Structure, Robustness and Function. Cambridge University Press. ISBN 9781139489270.
- Golumbic, Martin (1980). Algorithmic Graph Theory and Perfect Graphs. Academic Press.
- Harary, Frank (1969). Graph Theory. Reading, Massachusetts: Addison-Wesley.
- Harary, Frank; Palmer, Edgar M. (1973). Graphical Enumeration. New York, New York: Academic Press.
- Mahadev, N. V. R.; Peled, Uri N. (1995). Threshold Graphs and Related Topics. North-Holland.
- Newman, Mark (2010). Networks: An Introduction. Oxford University Press.
- Kepner, Jeremy; Gilbert, John (2011). Graph Algorithms in The Language of Linear Algebra. Philadelphia, Pennsylvania: SIAM. ISBN 978-0-898719-90-1.
External links
| Wikimedia Commons has media related to Graph theory. |
- Hazewinkel, Michiel, ed. (2001) [1994], "Graph theory", Encyclopedia of Mathematics, Springer Science+Business Media B.V. / Kluwer Academic Publishers, ISBN 978-1-55608-010-4
- Graph theory tutorial
- A searchable database of small connected graphs
- A survey of repositories in graph theory
- Image gallery: graphs at the Wayback Machine (archived February 6, 2006)
- Concise, annotated list of graph theory resources for researchers
- rocs — a graph theory IDE
- The Social Life of Routers — non-technical paper discussing graphs of people and computers
- Graph Theory Software — tools to teach and learn graph theory
- Online books, and library resources in your library and in other libraries about graph theory
- A list of graph algorithms with references and links to graph library implementations
Online textbooks
- Phase Transitions in Combinatorial Optimization Problems, Section 3: Introduction to Graphs (2006) by Hartmann and Weigt
- Digraphs: Theory Algorithms and Applications 2007 by Jorgen Bang-Jensen and Gregory Gutin
- Graph Theory, by Reinhard Diestel
| Foundations | |
|---|---|
| Algebra | |
| Analysis | |
| Discrete | |
| Geometry | |
| Number theory | |
| Topology | |
| Applied | |
| Computational | |
| Related topics | |
| |

| Authority control |
|
|---|