Christmas Price Index
The Christmas Price Index is a tongue-in-cheek economic indicator, maintained by the U.S. bank PNC Wealth Management, which tracks the cost of the items in the carol "The Twelve Days of Christmas".[5][6]
.svg.png)
| Christmas Price Index (US$) | |||
|---|---|---|---|
| Year | Christmas Price Index |
Δ% in CPI | True Cost of Christmas |
| 1984 | $12,623.10 | +1.44% | $61,318.94 |
| 1985 | $12,765.99 | +1.13% | $62,818.92 |
| 1986 | $12,920.25 | +1.21% | $63,402.22 |
| 1987 | $13,871.75 | +7.36% | $68,740.80 |
| 1988 | $13,785.63 | −0.62% | $67,745.74 |
| 1989 | $14,598.78 | +5.90% | $70,961.21 |
| 1990 | $15,231.72 | +4.34% | $72,205.12 |
| 1991 | $15,455.79 | +1.47% | $71,907.19 |
| 1992 | $15,581.96 | +0.82% | $71,618.71 |
| 1993 | $15,760.70 | +1.15% | $72,258.42 |
| 1994 | $15,944.20 | +1.16% | $73,258.42 |
| 1995 | $12,481.65 | −21.72% | $51,764.94 |
| 1996 | $13,195.86 | +5.72% | $54,478.36 |
| 1997 | $13,343.86 | +1.12% | $55,086.26 |
| 1998 | $14,214.90 | +6.53% | $58,405.09 |
| 1999 | $14,940.17 | +5.10% | $59,719.33 |
| 2000 | $15,210.22 | +1.81% | $60,307.18 |
| 2001 | $15,748.81 | +3.54% | $62,935.17 |
| 2002 | $14,558.05 | −7.56% | $54,951.31 |
| 2003 | $16,885.28 | +15.99% | $65,264.28 |
| 2004 | $17,296.91 | +2.44% | $66,334.46 |
| 2005 | $18,348.87 | +6.08% | $72,608.02 |
| 2006 | $18,920.59 | +3.12% | $75,122.03 |
| 2007 | $19,507.25 | +3.10% | $78,100.10 |
| 2008 | $21,080.10 | +8.06% | $86,608.51 |
| 2009 | $21,465.56 | +1.83% | $87,402.81 |
| 2010 | $23,439.38 | +9.20% | $96,824.29 |
| 2011 | $24,263.18 | +3.50% | $101,119.84 |
| 2012 | $25,431.18[1] | +6.1%[1] | $107,300.24[1] |
| 2013 | $27,393.18[2][3] | +7.70% | $114,651.18[2] |
| 2014 | $27,673.21 | +1.00% | $116,273.06[4] |
| 2015 | $34,130.99 | +0.6% | $155,407.18 |
| 2016 | $34,363.49 | +0.7% | $156,507.88 |
| 2017 | $34,558.65 | +0.6% | $157,558.00 |
| 2018 | $38,926.03 | +11.2% | $170,362.26 |
| 2019 | $38,993.59 | +0.17% | $170,298.03 |
Origins
The Christmas Price Index was conceived by the bank's chief economist as a humorous commodity price index to measure the changing cost of goods over time. Commodity price indices, as compiled by economics, use a "market basket" of certain goods and then measure the cost of the goods from year to year to gauge inflation in different sectors of the economy.
The Christmas Price Index chose the items in the popular Christmas carol "The Twelve Days of Christmas" as its market basket: a partridge in a pear tree, two turtle doves, three French hens, four calling birds, five golden rings, six geese, seven swans, eight maids, nine dancing ladies, ten leaping lords, eleven pipers, and twelve drummers. According to tradition, the purchasing of the items begins on December 25 and ends on January 5.
Methodology
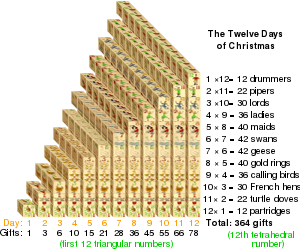
PNC compiles both a "Christmas Price Index" and "The True Cost of Christmas." The "Christmas Price Index" is calculated by adding the cost of the items in the song. The "True Cost of Christmas," however, is calculated by buying a partridge in a pear tree on each of the twelve days, buying two turtle doves from the second day onward, for a total of 22 turtle doves, etc., for the complete set of 364 items.[7]
The price of each item is set as follows:[8]
- The pear tree comes from a local Philadelphia nursery.
- The partridge, turtle dove, and French hen prices are determined by the Cincinnati Zoo and Botanical Garden.
- The price of a canary at Petco is used for the calling [sic] bird, though the price of a blackbird (colly bird) may reflect the original version of the song.
- Gordon Jewelers sets the cost of the gold rings, though the gold rings of the song may actually refer to ring-necked pheasants.[9]
- The maids are assumed to be unskilled laborers earning the federal minimum wage.
- A Philadelphia dance company provides estimates for the salary of "ladies dancing".
- The Philadelphia Ballet estimates the salary for the "leaping lords".
- The going rate for drummers and pipers is that of a Pennsylvania musicians' union.
Results
Like other light hearted economic indicators, such as The Economist's Big Mac Index which tracks the price of the Big Mac hamburger in different countries, the Christmas Price Index nevertheless produces results which have meaningful interpretations.[10][11]
In general, the prices in the index have reflected the United States's growing service economy—prices for goods have mostly fallen, but prices for labor have risen greatly. The cost of hiring ladies and lords, for example, has risen over 300 percent. After the high cost of the dancers, the seven swans are the most expensive item on the index; the unpredictable breeding cycle of swans makes their supply uncertain.[12] Much as the United States Consumer Price Index excludes volatile energy and food prices from its "core" index, the core Christmas Price Index excludes the swans; for 2008, the total price index rose 8.1% from 2007, while the core index rose only 1.1%.[13] The cheapest item in the index is the partridge, which, in 2008, could be purchased for $20.[13] Costs have generally risen and fallen along with the standard Consumer Price Index.
The survey also tracks the cost of ordering the items online; doing so is significantly more expensive, in part due to shipping costs.[8] In 2008, PNC estimated the total cost at $31,956.62, up 2.3% from 2007, while purchasing all 364 items online would cost $131,150.76, an increase of 1.8%.[13] However, if the buyer were to purchase each item from the least expensive vendor, the total index would be $19,844.95, a discount of 5.86%.[13]
Criticisms
The Christmas Price Index has been criticized for a number of reasons.[14] First, the index does not clearly define the products that comprise each of the twelve gifts. For example, the price for the eight "maids a-milking" only includes the cost of eight laborers at Federal minimum wage, while milking also requires at least a milk cow, goat, or other such animal, which is an additional cost.
Second, the index also relies on only one data source per gift when a more reliable approach might use several retailers.
Third, the index prices products that do not actually correspond with the actual gift described. The ten "lords a-leaping" are valued by using the cost of hiring male ballet dancers instead of real lords, as lordships are a title of nobility not recognized in the United States.
References
- "12 Days of Christmas total cost now tops $107,000". News 13. Orlando. Associated Press. November 26, 2012. Archived from the original on January 18, 2013. Retrieved November 5, 2015.
- Goyeneche, Ainhoa (December 2, 2013). "PNC's Twelve Days of Christmas Price Index for 2013". Bloomberg. Retrieved January 3, 2017.
- Aldinger, Alan (December 2, 2013). "PNC Christmas Price Index: Bah, Humbug! PNC Christmas Price Index Surges 7.7 Percent In 2013; Prices Would Cause Ebenezer Scrooge To Cringe" (PDF) (Press release). PNC Financial Services. Retrieved December 16, 2013.
- Ferro, Shane (December 1, 2014). "Here's The True Cost Of Christmas". BusinessInsider. Retrieved January 3, 2017.
- Spinner, Jackie (December 20, 2007). "Two Turtledoves, My Love: But Maids-a-Milking? Gone. Whole List? Money Doesn't Grow on Pear Trees". The Washington Post. Retrieved December 20, 2007.
- Olson, Elizabeth (December 20, 2007). "The '12 Days' Index Shows a Record Increase". The New York Times.
- Gaffen, David (January 5, 2007). "That's One Expensive Song". The Wall Street Journal. Retrieved December 20, 2007.
- PNC Financial Services. "PNC Christmas Price Index: History/FAQ". PNC Financial Services. Archived from the original on December 29, 2007. Retrieved December 20, 2007.
- Mikkelson, David (December 24, 2013). "The Twelve Days of Christmas: Was the song 'The Twelve Days of Christmas' created as a secret code by persecuted Catholics?". Snopes.com. Retrieved January 3, 2017.
- Nephin, Dan (November 26, 2007). "'Twelve Days of Christmas' Gets Costly". Associated Press. Archived from the original on December 8, 2007. Retrieved December 20, 2007 – via Google News.
- O'Hara, F.M., Jr.; O'Hara, F.M., III (2000). Handbook of United States Economic and Financial Indicators. Westport, CT: Greenwood Press. p. 328. ISBN 0-313-27450-9.
- Olson, Elizabeth (December 23, 2006). "Those Leaping Lords Don't Come Cheap". The New York Times. Retrieved December 20, 2007.
- PNC Financial Services (2008). "PNC Christmas Price Index" (PDF). PNC Financial Services. Retrieved December 17, 2008.
- Fulcrum Inquiry (December 2011). "The 12 Days of Christmas: A Lesson In How A Complex Appraisal Can Go Astray". Fulcrum Inquiry. Retrieved December 13, 2011.
External links
- PNC Christmas Price Index Web site