Cepstrum
Cepstrum (/ˈkɛpstrʌm, ˈsɛp-, -strəm/; plural cepstra) is the result of a mathematical transformation in the field of Fourier Analysis. The concept was introduced 1963 in an article of Bogert, Healy, and Tukey.[1] It serves as a tool to investigate periodic structures within frequency spectra.[2] Such effects are related i.e. to noticeable echos/reflections in the signal or to the occurrence of harmonic frequencies (partials, overtones). Mathematically it deals with the problem of deconvolution of signals in the frequency space.[3]
References to the Bogert paper, in a bibliography, are often edited incorrectly. The terms "quefrency", "alanysis", "cepstrum" and "saphe" were invented by the authors by rearranging some letters in frequency, analysis, spectrum and phase. The new invented terms are defined by analogies to the older terms.
Thus: The name cepstrum was derived by reversing the first four letters of "spectrum". Operations on cepstra are labelled quefrency analysis (aka quefrency alanysis[1]), liftering, or cepstral analysis. It may be pronounced in the two ways given, the second having the advantage of avoiding confusion with "kepstrum", which also exists (see below).
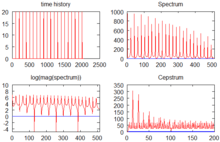
The cepstrum is the result of following sequence of mathematical operations:
- transformation of a signal from time domain to frequency domain
- log of the spectral amplitudes
- transformation to quefrency domain, where the final independent variable, the quefrency, has actually a time scale.[1][2][3]
The concept of the "Cepstrum" lead to a large number of applications:[2][3]
- dealing with reflection inference (radar, sonar applications, earth seismology)
- estimation of speaker fundamental frequency (pitch)
- speech analysis and recognition
- medical applications in analysis of electroencephalogram (EEG) and brain waves
- machine vibration analysis based on harmonic patterns (gearbox faults, turbine blade failures, ...)[2][4][5]
The "Cepstrum" is used in many variants. Most important are:
- Power Cepstrum: The logarithm is taken from the "Power Spectrum"
- Complex Cepstrum: The logarithm is taken from the "Spectrum", which is calculated via fourier analysis
- Real Cepstrum: The logarithm is taken from the amplitude values of the "Spectrum". The phase information is neglected.
There exist more variants, but they are not explained in detail within this page.
Abbreviations
Following abbreviations are used in the formulas to explain the cepstrum in more detail:
| Abbreviation | Explanation |
|---|---|
| Signal, which is a function of time | |
| Cepstrum | |
| Fourier transform: The abbreviation can stand i.e. for a continuous fourier transform, a discrete fourier transform (DFT) or even a z-transform, as the z-transform is a generalization of the DFT.[3] | |
| Inverse of the fourier transform | |
| Power spectrum | |
| Logarithm of x. The choice of the base b depends on the user. In some articles the base is not specified, others prefer base 10 or e. The choice of the base has not impact on the basic calculation rules, but sometimes base e leads to simplifications (see "Complex Cepstrum"). | |
| Absolute value, or magnitude of a complex value, which is calculated from real- and imaginary part using the Pythagorean theorem. | |
| Phase angle of a complex value |


Power Cepstrum
The "Cepstrum" was originally defined as "Power Cepstrum" by following relationship:[1][3]

The power cepstrum has main applications in analysis of sound and vibration signals. It is a complementary tool to spectral analysis.[2]
Sometimes it is also defined as:[2]

Due to this formula, the cepstrum is also sometimes called the spectrum of a spectrum. It can be shown that both formulas are consistent with each other as the frequency spectral distribution remains the same, the only difference being a scaling factor [2] which can be applied afterwards. Some articles prefer the second formula.[2][4]
Other notations are possible due to the fact, that the log of the power spectrum is equal to the log of the spectrum, if a scaling factor 2 is applied:[5]

and therefore:
- , or
- , which provides a relationship to the real cepstrum (see below).


Further, it shall be noted, that the final squaring operation in the formula for the power spectrum is sometimes called unnecessary[3] and therefore sometimes omitted.[4][2]

Complex Cepstrum
The complex cepstrum was defined by Oppenheim in his development of homomorphic system theory.[6][7] The formula is provided also in other literature.[2]

As is complex the log-term can be also written with as a product of magnitude and phase, and subsequently as a sum. Further simplification is obvious, if log is a natural logarithm with base e:


Therefore: The complex cepstrum can be also written as:[8]

The complex cepstrum retains the information about the phase. Thus it is always possible to return from the quefrency domain to the time domain by the inverse operation:[2][3]
- , where b is the base of the used logarithm

Main application is the modification of the signal in the quefrency domain (liftering) as an analog operation to filtering in the spectral frequency domain.[2][3] An example is the suppression of echo effects by suppression of certain quefrencies.[2]
Real Cepstrum
The real cepstrum is derived from the complex cepstrum by setting the phase of the spectrum to zero.[4] It has a focus on periodic effects in the amplitudes of the spectrum:

Thus, it is also directy related to the power spectrum, as (see above):

Other definitions related to "Cepstrum"
A short-time cepstrum analysis was proposed by Schroeder and Noll for application to pitch determination of human speech.[9][10][11]
The phase cepstrum is related to the complex cepstrum as
- phase spectrum = (complex cepstrum − time reversal of complex cepstrum)2.
The kepstrum, which stands for "Kolmogorov-equation power-series time response", is similar to the cepstrum and has the same relation to it as expected value has to statistical average, i.e. cepstrum is the empirically measured quantity, while kepstrum is the theoretical quantity. It was in use before the cepstrum.[12][13]
Applications
The cepstrum can be seen as information about the rate of change in the different spectrum bands. It was originally invented for characterizing the seismic echoes resulting from earthquakes and bomb explosions. It has also been used to determine the fundamental frequency of human speech and to analyze radar signal returns. Cepstrum pitch determination is particularly effective because the effects of the vocal excitation (pitch) and vocal tract (formants) are additive in the logarithm of the power spectrum and thus clearly separate.[11]
The autocepstrum is defined as the cepstrum of the autocorrelation. The autocepstrum is more accurate than the cepstrum in the analysis of data with echoes.
The cepstrum is a representation used in homomorphic signal processing, to convert signals combined by convolution (such as a source and filter) into sums of their cepstra, for linear separation. In particular, the power cepstrum is often used as a feature vector for representing the human voice and musical signals. For these applications, the spectrum is usually first transformed using the mel scale. The result is called the mel-frequency cepstrum or MFC (its coefficients are called mel-frequency cepstral coefficients, or MFCCs). It is used for voice identification, pitch detection and much more. The cepstrum is useful in these applications because the low-frequency periodic excitation from the vocal cords and the formant filtering of the vocal tract, which convolve in the time domain and multiply in the frequency domain, are additive and in different regions in the quefrency domain.
Recently cepstrum based deconvolution was used to remove the effect of the stochastic impulse trains, which originates an sEMG signal, from the power spectrum of sEMG signal itself. In this way, only information on motor unit action potential (MUAP) shape and amplitude were maintained, and then, used to estimate the parameters of a time-domain model of the MUAP itself.[14]
Cepstral concepts
The independent variable of a cepstral graph is called the quefrency.[15] The quefrency is a measure of time, though not in the sense of a signal in the time domain. For example, if the sampling rate of an audio signal is 44100 Hz and there is a large peak in the cepstrum whose quefrency is 100 samples, the peak indicates the presence of a fundamental frequency that is 44100/100 = 441 Hz. This peak occurs in the cepstrum because the harmonics in the spectrum are periodic and the period corresponds to the fundamental frequency, since harmonics are integer multiples of said fundamental frequency.
Note that a pure sine wave can not be used to test the cepstrum for its pitch determination from quefrency as a pure sine wave does not contain any harmonics and does not lead to quefrency peaks. Rather, a test signal containing harmonics should be used (such as the sum of at least two sines where the second sine is some harmonic (multiple) of the first sine, or better, a signal with a square or triangle waveform, as such signals provide many overtones in the spectrum.).
Filtering
Playing further on the anagram theme, a filter that operates on a cepstrum might be called a lifter. A low-pass lifter is similar to a low-pass filter in the frequency domain. It can be implemented by multiplying by a window in the quefrency domain and then converting back to the frequency domain, resulting in a modified signal, i.e. with signal echo being reduced.
Convolution
A very important property of the cepstral domain is that the convolution of two signals can be expressed as the addition of their complex cepstra:

References
- B. P. Bogert, M. J. R. Healy, and J. W. Tukey: "The Quefrency Alanysis [sic] of Time Series for Echoes: Cepstrum, Pseudo Autocovariance, Cross-Cepstrum and Saphe Cracking". Proceedings of the Symposium on Time Series Analysis (M. Rosenblatt, Ed) Chapter 15, 209-243. New York: Wiley, 1963.
- Norton, Michael Peter; Karczub, Denis (November 17, 2003). Fundamentals of Noise and Vibration Analysis for Engineers. Cambridge University Press. ISBN 0-521-49913-5.
- D. G. Childers, D. P. Skinner, R. C. Kemerait, "The Cepstrum: A Guide to Processing", Proceedings of the IEEE, Vol. 65, No. 10, October 1977, pp. 1428–1443.
- R.B. Randall: Cepstrum Analysis and Gearbox Fault Diagnosis, Brüel&Kjaer Application Notes 233-80, Edition 2.
- Beckhoff information system: TF3600 TC3 Condition Monitoring: Gearbox monitoring (online, 4.4.2020).
- A. V. Oppenheim, "Superposition in a class of nonlinear systems" Ph.D. diss., Res. Lab. Electronics, M.I.T. 1965.
- A. V. Oppenheim, R. W. Schafer, "Digital Signal Processing", 1975 (Prentice Hall).
- R.B. Randall:, "A history of cepstrum analysis and its application to mechanical problems", in: Mechanical Systems and Signal Processing, Volume 97, December 2017 (Elsevier).
- A. Michael Noll and Manfred R. Schroeder, "Short-Time 'Cepstrum' Pitch Detection," (abstract) Journal of the Acoustical Society of America, Vol. 36, No. 5, p. 1030
- A. Michael Noll (1964), “Short-Time Spectrum and Cepstrum Techniques for Vocal-Pitch Detection”, Journal of the Acoustical Society of America, Vol. 36, No. 2, pp. 296–302.
- A. Michael Noll (1967), “Cepstrum Pitch Determination”, Journal of the Acoustical Society of America, Vol. 41, No. 2, pp. 293–309.
- "Predictive decomposition of time series with applications to seismic exploration", E. A. Robinson MIT report 1954; Geophysics 1967 vol. 32, pp. 418–484; "Use of the kepstrum in signal analysis", M. T. Silvia and E. A. Robinson, Geoexploration, volume 16, issues 1–2, April 1978, pages 55–73.
- "A kepstrum approach to filtering, smoothing and prediction with application to speech enhancement", T. J. Moir and J. F. Barrett, Proc. Royal Society A, vol. 459, 2003, pp. 2957–2976.
- G. Biagetti, P. Crippa, S. Orcioni, and C. Turchetti, “Homomorphic deconvolution for muap estimation from surface emg signals,” IEEE Journal of Biomedical and Health Informatics, vol. 21, no. 2, pp. 328– 338, March 2017.
- Steinbuch, Karl W.; Weber, Wolfgang; Heinemann, Traute, eds. (1974) [1967]. Taschenbuch der Informatik - Band III - Anwendungen und spezielle Systeme der Nachrichtenverarbeitung. Taschenbuch der Nachrichtenverarbeitung (in German). 3 (3 ed.). Berlin, Germany: Springer Verlag. pp. 272–274. ISBN 3-540-06242-4. LCCN 73-80607.
Further reading
- D. G. Childers, D. P. Skinner, R. C. Kemerait, "The Cepstrum: A Guide to Processing", Proceedings of the IEEE, Vol. 65, No. 10, October 1977, pp. 1428–1443.
- "Speech Signal Analysis"
- "Speech analysis: Cepstral analysis vs. LPC", www.advsolned.com
- "A tutorial on Cepstrum and LPCCs"
- Alan V. Oppenheim and Ronald W. Schafer, "From Frequency to Quefrency: A History of the Cepstrum", IEEE SIGNAL PROCESSING MAGAZINE, Sep. 2004, pp. 95–99