Arizona's 5th congressional district
Arizona's 5th congressional district is a congressional district located in the U.S. state of Arizona.
| Arizona's 5th congressional district | |||
|---|---|---|---|
.tif.png) Arizona's 5th congressional district - since January 3, 2013. | |||
| Representative |
| ||
| Area | 1,423 sq mi (3,690 km2) | ||
| Distribution |
| ||
| Population (2015) | 789,400[1] | ||
| Median income | $71,675[2] | ||
| Ethnicity |
| ||
| Cook PVI | R+15[3] | ||
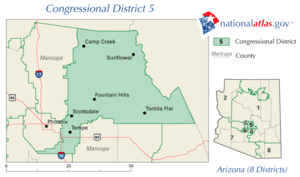
The district contains Gilbert, Queen Creek, southern and eastern Chandler, and eastern Mesa. It is within eastern Maricopa County, and includes most of the East Valley.
It is currently represented by Republican Andy Biggs, who was elected in November 2016.
After redistricting in 2010, most of the 5th's territory became the 9th district, while the 5th included most of the territory in the old 6th district.
- External links
History
Arizona picked up a fifth district after the 1980 Census. It covered most of the southeastern portion of the state, though the bulk of its population was located in the eastern half of Tucson. It was a Republican-leaning swing district, though a Democrat won it when it was first contested in 1982 before giving way to a Republican in 1984.
After the 2000 census, this district essentially became the 8th district, while most of the Maricopa County portion of the old 6th district became the new 5th district. This version of the 5th covered all of Tempe and Scottsdale and portions of Chandler, Mesa and the Ahwatukee section of Phoenix. Although Republicans outnumbered Democrats by about 40,000 voters, the 5th district was considered far less conservative than other suburban Phoenix districts. George W. Bush received 54% of the vote in this district in 2004 and home state candidate John McCain narrowly won the district in 2008 with 51.70% of the vote while Barack Obama received 47.17%.
After the 2010 census, this district mostly became the 9th district, while the 5th was reconfigured to take in most of the East Valley. This area had previously been the 1st district from 1951 to 2003 and the 6th district from 2003 to 2013. Like its predecessors, this district is heavily Republican.
Recent election results from statewide races
| Year | Office | Winner |
|---|---|---|
| 2000 | President | Bush 54 - 43% |
| 2004 | President | Bush 54 - 45% |
| 2008 | President | McCain 52 - 47% |
| 2012 | President | Romney 64 - 35% |
| 2016 | President | Trump 58 - 37% |
List of members representing the district
Arizona began sending a fifth member to the House after the 1980 Census.
| Representative | Party | Years | Cong ress |
Electoral history | Description and Counties[4][5][6] |
|---|---|---|---|---|---|
 James F. McNulty Jr. |
Democratic | January 3, 1983 – January 3, 1985 |
98th | Elected in 1982. Lost re-election. |
Southeast Arizona, including parts of Tucson: Cochise, Greenlee, Graham (part), Pima (part), Pinal (part), Santa Cruz (part) |
 Jim Kolbe |
Republican | January 3, 1985 – January 3, 2003 |
99th 100th 101st 102nd 103rd 104th 105th 106th 107th |
First elected in 1984. Re-elected in 1986. Re-elected in 1988. Re-elected in 1990. Re-elected in 1992. Re-elected in 1994. Re-elected in 1996. Re-elected in 1998. Re-elected in 2000. Redistricted to the 8th district. | |
| Southeast Arizona, including parts of Tucson: Cochise, Graham (part), Pima (part), Pinal (part) | |||||
 J. D. Hayworth |
Republican | January 3, 2003 – January 3, 2007 |
108th 109th |
Redistricted from the 6th district. Re-elected in 2002. Re-elected in 2004. Lost re-election. |
 Maricopa (part): Parts of Metro Phoenix |
 Harry Mitchell |
Democratic | January 3, 2007 – January 3, 2011 |
110th 111th |
First elected in 2006. Re-elected in 2008. Lost re-election. | |
 David Schweikert |
Republican | January 3, 2011 – January 3, 2013 |
112th | First elected in 2010. Redistricted to the 6th district. | |
 Matt Salmon |
Republican | January 3, 2013 – January 3, 2017 |
113th 114th |
Elected in 2012. Re-elected in 2014. Retired. |
Maricopa (part): Southeastern parts of Metro Phoenix |
 Andy Biggs |
Republican | January 3, 2017 – Present |
115th 116th |
First elected in 2016. Re-elected in 2018. |
Recent election results
2002
| Party | Candidate | Votes | % | ± | |
|---|---|---|---|---|---|
| Republican | J.D. Hayworth | 103,870 | 61.17% | ||
| Democratic | Chris Columbus | 61,559 | 36.25% | ||
| Libertarian | Warren Severin | 4,383 | 2.58% | ||
| Majority | 42,311 | 24.92% | |||
| Total votes | 169,812 | 100.00 | |||
| Republican hold | |||||
2004
| Party | Candidate | Votes | % | ± | |
|---|---|---|---|---|---|
| Republican | J.D. Hayworth* | 159,455 | 59.50% | ||
| Democratic | Elizabeth Rogers | 102,363 | 38.19% | ||
| Libertarian | Michael Kielsky | 6,189 | 2.31% | ||
| Majority | 57,092 | 21.31% | |||
| Total votes | 268,007 | 100.00 | |||
| Republican hold | |||||
2006
| Party | Candidate | Votes | % | ± | |
|---|---|---|---|---|---|
| Democratic | Harry Mitchell | 101,838 | 50.41% | ||
| Republican | J.D. Hayworth* | 93,815 | 46.44% | ||
| Libertarian | Warren Severin | 6,357 | 3.15% | ||
| Majority | 8,023 | 3.97% | |||
| Total votes | 202,010 | 100.00 | |||
| Democratic gain from Republican | |||||
2008
| Party | Candidate | Votes | % | ± | |
|---|---|---|---|---|---|
| Democratic | Harry Mitchell* | 149,033 | 53.16% | ||
| Republican | David Schweikert | 122,165 | 43.57% | ||
| Libertarian | Warren Severin | 9,158 | 3.27% | ||
| Majority | 26,868 | 9.59% | |||
| Total votes | 280,365 | 100.00 | |||
| Democratic hold | |||||
2010
| Party | Candidate | Votes | % | ± | |
|---|---|---|---|---|---|
| Republican | David Schweikert | 110,374 | 52.00% | ||
| Democratic | Harry Mitchell* | 91,749 | 43.23% | ||
| Libertarian | Nick Coons | 10,127 | 4.77% | ||
| Majority | 18,625 | 8.77% | |||
| Total votes | 212,250 | 100.00 | |||
| Republican gain from Democratic | |||||
2012
| Party | Candidate | Votes | % | ± | |
|---|---|---|---|---|---|
| Republican | Matt J. Salmon | 183,470 | 67.19% | ||
| Democratic | Spencer Morgan | 89,589 | 32.81% | ||
| Majority | 93,881 | 34.38% | |||
| Total votes | 273,059 | 100.00 | |||
| Republican hold | |||||
2014
| Party | Candidate | Votes | % | ± | |
|---|---|---|---|---|---|
| Republican | Matt J. Salmon | 124,867 | 69.58% | ||
| Democratic | James Woods | 54,596 | 30.42% | ||
| Majority | 70,271 | 39.2% | |||
| Total votes | 179,463 | 100.00 | |||
| Republican hold | |||||
2016
| Party | Candidate | Votes | % | ± | |
|---|---|---|---|---|---|
| Republican | Andy Biggs | 205,184 | 64.10% | ||
| Democratic | Talia Fuentes | 114,940 | 35.90% | ||
| Majority | 90,244 | 28.2% | |||
| Total votes | 320,124 | 100 | |||
| Republican hold | |||||
2018
| Party | Candidate | Votes | % | ± | |
|---|---|---|---|---|---|
| Republican | Andy Biggs | 141,432 | 59.4% | ||
| Democratic | Joan Greene | 96,758 | 40.6% | ||
| Majority | 44,674 | 18.8% | |||
| Total votes | 238,190 | 100 | |||
| Republican hold | |||||
References
- https://www.census.gov/mycd/?st=04&cd=05
- "Partisan Voting Index – Districts of the 115th Congress" (PDF). The Cook Political Report. April 7, 2017. Retrieved April 7, 2017.
- Martis, Kenneth C., The Historical Atlas of United States Congressional Districts, 1789-1983. New York: Macmillan Publishing, 1982.
- Martis, Kenneth C., The Historical Atlas of Political Parties in the United States Congress, 1789-1989. New York: Macmillan Publishing, 1989.
- Congressional Directory: Browse 105th Congress Archived February 17, 2011, at the Wayback Machine