Angle-resolved photoemission spectroscopy
Angle-resolved photoemission spectroscopy (ARPES) is an experimental technique in condensed matter physics used to measure the distribution in energy and momentum of the electrons ejected from a solid by ultraviolet light or soft X-rays in the process known as the photoelectric effect. The freed electrons carry detailed information about the electronic excitations in the material: their allowed energies and momenta (band structure), and scattering processes and interactions with other excitations in the bulk and at the surface of the system. This makes ARPES one of the most powerful direct methods of studying the electronic structure of solids.
_surface_state_-_21.22eV_300K.svg.png)
Principle
The technique is a refinement of ordinary photoemission spectroscopy. Photons of energy are used to stimulate the transition of electrons from occupied to unoccupied electronic states of the solid; if the photon's energy is greater than the binding energy of an electron, the electron will eventually leave the solid and be observed with kinetic energy at an angle relative to the surface normal, characteristic of the studied material. The electron emission intensity maps are representative of the intrinsic distribution of the electrons in the solid expressed in terms of their energy , and the Bloch wave vector , which is related to their crystal momentum and group velocity. The Bloch wave vector is linked to the measured electron's momentum , , of which only the component parallel to the surface is preserved. Thus, from ARPES, only is known for certain, and its magnitude is given by . Because of this, and its pronounced surface sensitivity, the technique is best suited for the complete characterization of the band structure in low-dimensional systems, but is widely used for three-dimensional materials as well. For those, the perpendicular component of the wave vector is usually approximated with the assumption of a parabolic, free-electron-like final state with the bottom at energy and is parameterized as .[1][2]


Instrumentation
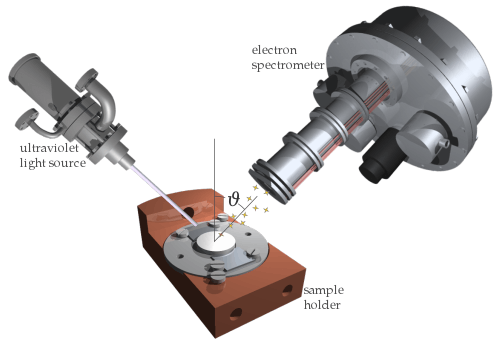
A typical instrument for angle-resolved photoemission consists of a light source, sample holder attached to a manipulator, and an electron spectrometer that are all part of an ultra-high vacuum system which provides necessary protection from adsorbates for the sample surface, and eliminates scattering of the electrons on their way to the analyzer.
The light source delivers monochromatic, usually polarized, focused, high-intensity photon beam (~1012 photons/s) to the sample. They range from compact noble-gas discharge UV lamps and radio-frequency plasma sources (10–40 eV), UV lasers (5–11 eV) to synchrotron insertion devices optimized for different parts of the EM spectrum (10 eV in the ultraviolet to 1000 eV X-rays).
The sample holder accommodates the samples of crystalline materials whose electronic properties are to be investigated. It facilitates their insertion into vacuum, cleavage to expose clean surfaces, precise manipulation as the extension of a vacuum manipulator (for translations along three axes, and rotations to adjust the sample's polar, azimuth or tilt angles), cooling to temperatures as low as 1 K with the help of cryogenic liquefied gasses, cryocoolers, and dilution refrigerators, heating by resistive heaters (few hundred °C) or e-beam bombardment (up to 2000 °C), precise temperature measurement and control, beam calibration, etc.

The role of the electron spectrometer in ARPES is to disperse along two spatial directions the electrons reaching its entrance with respect to their kinetic energy and their emission angle when exiting the sample. In the type most often used, the hemispherical electron energy analyzer, the electrons first pass through an electrostatic lens that 1) picks those emitted from its own small focal spot on the sample, which is, conveniently, some 40 mm away from the entrance to the lens, 2) enhances the angular spread of the electron plume, and 3) serves it to the narrow entrance slit of the energy dispersing element with adjusted energy.
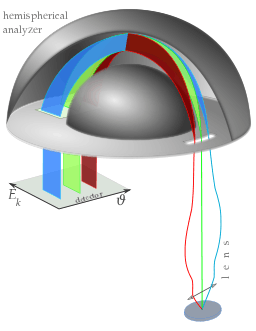
The energy dispersion is carried out for a narrow range of energies around the so-called pass energy in the direction perpendicular to the slit, so that the angular dispersion of the cylindrical lens is only preserved along the slit (typically ±15° over a 25 mm long, 0.1 mm wide slit). The hemispheres of the energy analyzer are kept at constant voltages so that the central trajectory is followed by those electrons that have the kinetic energy equal to the set pass energy; those with higher or lower energy end up closer to the outer or the inner hemisphere at the other end of the analyzer. This is where an electron detector is mounted, usually in the form of a 40 mm microchannel plate paired with a fluorescent screen. Electron detection events are recorded using an outside camera and counted in hundreds of thousands separate angle vs. kinetic energy channels. Some instruments are additionally equipped with an electron extraction tube at one side of the detector to enable the measurement of the electrons' spin polarization.
Modern analyzers are capable of resolving the electron emission angles by nearly 0.1°. Energy resolution is pass-energy and slit-width dependent, so that one chooses between ultrahigh resolution and low intensity measurements (<1 meV at 1 eV pass energy), or energy resolutions of 10 or more meV at higher pass energies and with wider slits. The instrument's resolution shows up as artificial broadening of the spectral features: Fermi edge wider than the sample's temperature would require, and the theoretical electron's spectral function convolved by the instrument's resolution function in both energy and momentum/angle.
Sometimes, instead of hemispherical analyzers, time-of-flight analyzers are used. They, however, require pulsed photon sources and are most common in laser-based ARPES labs.
Fermi surface mapping
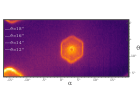
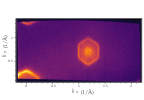
Electron analyzers that need a slit to prevent mixing of momentum and energy channels are only capable of taking angular maps along one direction. In order to take maps over energy and a two-dimensional momentum space, either the sample is rotated in the proper direction so that the slit receives electrons from adjacent emission angles, or the electron plume is steered inside the electrostatic lens with the sample fixed. The slit width will determine the step size of the angular scans: if a 30 mm long slit is served with a 30° plume, this will, in the narrower (say 0.5 mm) direction of the slit, average signal over a 0.5mm · 30°/30mm, that is, 0.5° span, which will be the maximal resolution of the scan in that other direction. Coarser steps will lead to missing data, and finer step to overlaps. The energy-angle-angle maps can be further processed to give energy-kx-ky maps, and sliced in such a way to display constant energy surfaces in the band structure and most importantly the Fermi surface map when cut near the Fermi level.
Emission angle to momentum conversion
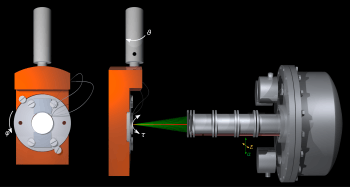
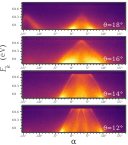
ARPES spectrometer measures angular dispersion in a slice α along its slit. Modern analyzers record these angles simultaneously, in their reference frame, in the range of ±15° or more. In order to map the band structure over a two-dimensional momentum space the sample is rotated while keeping the light spot on the surface fixed. The most common choice is to change the polar angle ϑ around the axis that is parallel to the slit, and adjust the tilt τ or azimuth φ so that emission from a particular region of the Brillouin zone can be reached. The measured electrons (green rays in images below) have these momentum components in the reference frame of the analyzer , where . The reference frame of the sample is rotated around the y axis by ϑ ( there has components ), then tilted around x by τ, resulting in . The components of the electron's crystal momentum known from ARPES in this mapping geometry are thus


- ,
- choose sign at depending on whether is prop. to or


If high symmetry axes of the sample are known and need to be aligned, a correction by azimuth φ can be applied, either by rotating around z, , or by rotating the map I(E, kx, ky) around origin in two-dimensional momentum planes.

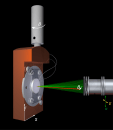 Analyzing electrons emitted into polar angle ϑ and α≤8° around.
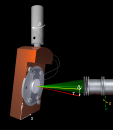 Polar angle ϑ, tilt τ, and α≤8°.
 Polar angle ϑ, tilt τ, and α≤8°. Azimuth is set to φ.
Theory
Theory of photoemission[2][1] is that of direct optical transitions between the states and of an N-electron system. The light excitation is introduced as the magnetic vector potential through the minimal substitution in the kinetic part of the quantum-mechanical Hamiltonian for the electrons in the crystal. The perturbation part of the Hamiltonian comes out to be


- .

In this treatment, the electron's spin coupling to the EM field is neglected. The scalar potential set to zero either by imposing the Weyl gauge [2] or by working in the Coulomb gauge in which becomes negligibly small far from the sources. Either way, the commutator is taken to be zero. Specifically, in Weyl gauge because the period of for ultraviolet light is about two orders of magnitude larger than the period of the electron's wave function. In both gauges it is assumed that the electrons at the surface had little time to respond to the incoming perturbation, and add nothing to either of the two potentials. Moreover, it is for most practical uses safe to neglect the quadratic term. Hence, .


The transition probability is calculated in time-dependent perturbation theory and is given by the Fermi's golden rule
- ,

Obviously, the delta distribution above says that energy is conserved when a photon of energy is absorbed .

If the electric field of an EM wave is written as , where , the vector potential holds its polarization, and equals to . The transition probability is then given in terms of the electric field as[3]


- .

In the sudden approximation, which assumes that an electron is instantaneously removed from the system of N electrons, the final and initial states of the system are taken as properly antisymmetrized products of the single particle states of the photoelectron , and the states representing the remaining N-1 electron systems.[2]


The photoemission current of electrons of energy and momentum is then expressed as the products of


- , known as the dipole selection rules for optical transitions, and
- , the one-electron removal spectral function known from the many-body theory of condensed matter physics


summed over all allowed initial and final states leading to the energy and momentum being observed.[2] Here, E is measured with respect to the Fermi level EF and Ek with respect to vacuum, so that where , the so-called work function, is the energy difference between the two referent levels that is material, surface orientation, and surface condition dependent. Since the allowed initial states are only those that are occupied, photoemission signal will reflect the Fermi-Dirac distribution function in the form of a temperature-dependent sigmoid-shaped drop of intensity in the vicinity of EF. In the simple case of a two-dimensional one-band electronic system the intensity relation further reduces to .[2]


Selection rules
The electronic states in crystals are organized in energy bands, which have associated energy band dispersions that are energy eigenvalues for delocalized electrons according to Bloch's theorem. From the plane-wave factor in Bloch's decomposition of the wave functions it follows that the only allowed transitions when no other particles are involved are between the states whose crystal momenta differ by the reciprocal lattice vectors , i.e. those states that are in the reduced zone scheme one above another (thus the name direct optical transitions).


Another set of selection rules comes from (or ) when the photon polarization contained in (or ) and symmetries of the initial and final one-electron Bloch states and are taken into account. Those can lead to the suppression of the photoemission signal in certain parts of the reciprocal space, or can tell about the specific atomic-orbital origin of the initial and final states.[4]


Many-body effects
The one-electron spectral function that is directly measured in ARPES maps the probability that the state of the system of N electrons from which one electron has been instantly removed is any of the ground states of the N-1 particle system:
- .

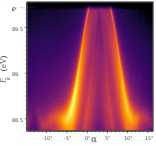
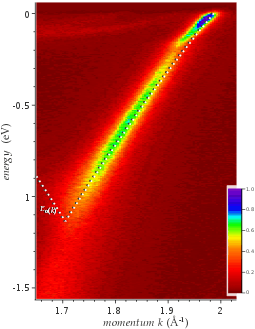
Were the electrons independent of one another, the N electron state with the state removed would be exactly an eigenstate of the N-1 particle system, and the spectral function would become an infinitely sharp delta function at the energy and momentum of the removed particle, that is, it would trace the dispersion of the independent particles in energy-momentum space. In the case of increased electron correlations, the spectral function broadens, and starts developing richer features that reflect the interactions in the underlying many-body system. These are customarily described by the complex correction to the single particle energy dispersion that is called the quasiparticle self energy, . It contains the full information about the renormalization of the electronic dispersion due to interactions, and the lifetime of the hole created by the excitation. Both can be determined experimentally from the analysis of high-resolution ARPES spectra, under a few reasonable assumptions. Namely, one can assume that the part of the spectrum is nearly constant along high-symmetry directions in momentum space, and that the only variable part comes from the spectral function, which in terms , where the two components of are usually taken to be only dependent on , reads


This function is known from ARPES as a scan along a chosen direction in momentum space, and is a two-dimensional map of the form . When cut at a constant energy , a Lorentzian in is obtained whose renormalized peak position is given by , and whose width at half maximum is determined by , as follows:[6][5]


The only remaining unknown in the analysis is the bare band . Fortunately, the bare band can be found in a self-consistent way by enforcing the Kramers-Kronig relation between the two components of the complex function obtained from the previous two equations. The algorithm is as follows: start with an ansatz bare band, calculate by eq. (2), transform it into using the Kramers-Kronig relation, then use this function to calculate the bare band dispersion on a discrete set of points by eq. (1), and feed to the algorithm its fit to a suitable curve as a new ansatz bare band; convergence is usually achieved in a few quick iterations.[5]


From this obtained self energy one can judge on the strength and shape of electron-electron correlations, electron-phonon (more generally, electron-boson) interaction, active phonon energies, quasiparticle lifetimes etc.[7][8][9][10][11]
Uses
ARPES has been used to map the occupied band structure of many metals and semiconductors, states appearing in the projected band gaps at their surfaces,[1]quantum well states that arise in systems with reduced dimensionality,[12] one-atom-thin materials like graphene[13] and transition metal dichalcogenides, as well as many flavors of topological materials.[14][15] It has also been used to map the underlying band structure, gaps, and quasiparticle dynamics in highly correlated materials like high-temperature superconductors and materials exhibiting charge density waves.[2][16][17][18]
When the electron dynamics in the bound states just above the Fermi level needs to be studied, two-photon excitation in so-called pump-probe setups (2PPE) is used. There, the first photon of low-enough energy is employed to excite electrons into unoccupied bands that are still below the energy necessary for photoemission (i.e. between the Fermi and vacuum levels). Then the second photon is used to kick these electrons out of the solid so that they can be measured in ARPES. By precisely timing the second photon, usually by using frequency multiplication of the low-energy pulsed laser and delay lines, the electron lifetime can be determined on the scale below picoseconds.
External links
References
- Hüfner, Stefan. (2003). Photoelectron Spectroscopy : Principles and Applications (Third rev. and enlarged ed.). Berlin, Heidelberg: Springer Berlin Heidelberg. ISBN 978-3-662-09280-4. OCLC 851391282.
- Damascelli, Andrea; Shen, Zhi-Xun; Hussain, Zahid (2003-04-17). "Angle-resolved photoemission spectroscopy of the cuprate superconductors". Reviews of Modern Physics. 75 (2): 473–541. arXiv:cond-mat/0208504. doi:10.1103/RevModPhys.75.473. ISSN 0034-6861.
- Wacker, Andreas. "Fermi's golden rule" (PDF). Teaching notes (Lund University).
- Cao, Yue; Waugh, J. A.; Zhang, X.-W.; Luo, J.-W.; Wang, Q.; Reber, T. J.; Mo, S. K.; Xu, Z.; Yang, A.; Schneeloch, J.; Gu, G. (2013-07-21). "In-Plane Orbital Texture Switch at the Dirac Point in the Topological Insulator Bi2Se3". Nature Physics. 9 (8): 499–504. arXiv:1209.1016. doi:10.1038/nphys2685. ISSN 1745-2473.
- Pletikosić, Ivo; Kralj, Marko; Milun, Milorad; Pervan, Petar (2012-04-24). "Finding the bare band: Electron coupling to two phonon modes in potassium-doped graphene on Ir(111)". Physical Review B. 85 (15): 155447. arXiv:1201.0777. Bibcode:2012PhRvB..85o5447P. doi:10.1103/PhysRevB.85.155447. ISSN 1098-0121.
- Kordyuk, A. A.; Borisenko, S. V.; Koitzsch, A.; Fink, J.; Knupfer, M.; Berger, H. (2005-06-09). "Bare electron dispersion from photoemission experiments". Physical Review B. 71 (21): 214513. arXiv:cond-mat/0405696. doi:10.1103/PhysRevB.71.214513. ISSN 1098-0121.
- Norman, M. R.; Ding, H.; Fretwell, H.; Randeria, M.; Campuzano, J. C. (1999-09-01). "Extraction of the Electron Self-Energy from Angle Resolved Photoemission Data: Application to Bi2212". Physical Review B. 60 (10): 7585–7590. arXiv:cond-mat/9806262. doi:10.1103/PhysRevB.60.7585. ISSN 0163-1829.
- LaShell, S.; Jensen, E.; Balasubramanian, T. (2000-01-15). "Nonquasiparticle structure in the photoemission spectra from the Be(0001) surface and determination of the electron self energy". Physical Review B. 61 (3): 2371–2374. Bibcode:2000PhRvB..61.2371L. doi:10.1103/PhysRevB.61.2371. ISSN 0163-1829.
- Valla, T.; Fedorov, A. V.; Johnson, P. D.; Hulbert, S. L. (1999-09-06). "Many-Body Effects in Angle-Resolved Photoemission: Quasiparticle Energy and Lifetime of a Mo(110) Surface State". Physical Review Letters. 83 (10): 2085–2088. arXiv:cond-mat/9904449. Bibcode:1999PhRvL..83.2085V. doi:10.1103/PhysRevLett.83.2085. ISSN 0031-9007.
- Hofmann, Ph; Sklyadneva, I Yu; Rienks, E D L; Chulkov, E V (2009-12-11). "Electron–phonon coupling at surfaces and interfaces". New Journal of Physics. 11 (12): 125005. Bibcode:2009NJPh...11l5005H. doi:10.1088/1367-2630/11/12/125005. ISSN 1367-2630.
- Veenstra, C. N.; Goodvin, G. L.; Berciu, M.; Damascelli, A. (2010-07-16). "Elusive electron-phonon coupling in quantitative analyses of the spectral function". Physical Review B. 82 (1): 012504. arXiv:1003.0141. Bibcode:2010PhRvB..82a2504V. doi:10.1103/PhysRevB.82.012504. ISSN 1098-0121.
- Chiang, T. -C (2000-09-01). "Photoemission studies of quantum well states in thin films". Surface Science Reports. 39 (7): 181–235. Bibcode:2000SurSR..39..181C. doi:10.1016/S0167-5729(00)00006-6. ISSN 0167-5729.
- Zhou, S. Y.; Gweon, G.-H.; Graf, J.; Fedorov, A. V.; Spataru, C. D.; Diehl, R. D.; Kopelevich, Y.; Lee, D.-H.; Louie, Steven G.; Lanzara, A. (2006-08-27). "First direct observation of Dirac fermions in graphite". Nature Physics. 2 (9): 595–599. arXiv:cond-mat/0608069. Bibcode:2006NatPh...2..595Z. doi:10.1038/nphys393. ISSN 1745-2473.
- Hsieh, D.; Qian, D.; Wray, L.; Xia, Y.; Hor, Y. S.; Cava, R. J.; Hasan, M. Z. (2008-04-24). "A topological Dirac insulator in a quantum spin Hall phase : Experimental observation of first strong topological insulator". Nature. 452 (7190): 970–974. arXiv:0902.1356. doi:10.1038/nature06843. ISSN 0028-0836. PMID 18432240.
- Liu, Z. K.; Zhou, B.; Wang, Z. J.; Weng, H. M.; Prabhakaran, D.; Mo, S.-K.; Zhang, Y.; Shen, Z. X.; Fang, Z.; Dai, X.; Hussain, Z. (2014-02-21). "Discovery of a Three-dimensional Topological Dirac Semimetal, Na3Bi". Science. 343 (6173): 864–867. arXiv:1310.0391. Bibcode:2014Sci...343..864L. doi:10.1126/science.1245085. ISSN 0036-8075. PMID 24436183.
- Kordyuk, A. A. (2014-05-02). "ARPES experiment in fermiology of quasi-2D metals (Review Article)". Low Temperature Physics. 40 (4): 286–296. arXiv:1406.2948. Bibcode:2014LTP....40..286K. doi:10.1063/1.4871745. ISSN 1063-777X.
- Lu, Donghui; Vishik, Inna M.; Yi, Ming; Chen, Yulin; Moore, Rob G.; Shen, Zhi-Xun (2012-01-03). "Angle-Resolved Photoemission Studies of Quantum Materials". Annual Review of Condensed Matter Physics. 3 (1): 129–167. doi:10.1146/annurev-conmatphys-020911-125027. ISSN 1947-5454.
- Zhou, Xingjiang; He, Shaolong; Liu, Guodong; Zhao, Lin; Yu, Li; Zhang, Wentao (2018-06-01). "New Developments in Laser-Based Photoemission Spectroscopy and its Scientific Applications: a Key Issues Review". Reports on Progress in Physics. 81 (6): 062101. arXiv:1804.04473. Bibcode:2018RPPh...81f2101Z. doi:10.1088/1361-6633/aab0cc. ISSN 0034-4885. PMID 29460857.