Action spectrum
An action spectrum is a graph of the rate of biological effectiveness plotted against wavelength of light.[1] It is related to absorption spectrum in many systems. Mathematically, it describes the inverse quantity of light required to evoke a constant response. It is very rare for an action spectrum to describe the level of biological activity, since biological responses are often nonlinear with intensity.
Action spectra are typically written as unit-less responses with peak response of one, and it is also important to distinguish if an action spectrum refers to quanta at each wavelength (mol or log-photons), or to spectral power (W).
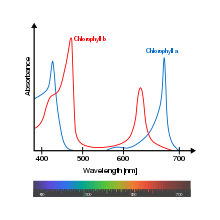
It shows which wavelength of light is most effectively used in a specific chemical reaction. Some reactants are able to use specific wavelengths of light more effectively to complete their reactions. For example, chlorophyll is much more efficient at using the red and blue regions than the green region of the light spectrum to carry out photosynthesis. Therefore, the action spectrum graph would show spikes above the wavelengths representing the colours red and blue.
The first action spectrum was made by T. W. Engelmann, who split light into its components by the prism and then illuminated Cladophora placed in a suspension of aerobic bacteria. He found that bacteria accumulated in the region of blue and red light of the split spectrum. He thus discovered the effect of the different wavelengths of light on photosynthesis and plotted the first action spectrum of photosynthesis.[2]
Further examples include suppression of melatonin by wavelength[3] and a variety of hazard functions, related to tissue damage from visible and near-visible light.[4]
See also
- Photosynthetically active radiation
- Photosynthesis
- Absorption spectrum
- Chlorophyll a
References
- Gorton HL (22 April 2010). "Biological Action Spectra". Photobiological Sciences Online. American Society for Photobiology. Retrieved 2020-01-18.
- Kumar V. Question Bank in Biology for Class Xi (fourth ed.). Tata McGraw-Hill. p. 311. ISBN 978-0-07-026383-3.
- Brainard GC, Hanifin JP, Greeson JM, Byrne B, Glickman G, Gerner E, Rollag MD (August 2001). "Action spectrum for melatonin regulation in humans: evidence for a novel circadian photoreceptor". The Journal of Neuroscience. 21 (16): 6405–12. doi:10.1523/JNEUROSCI.21-16-06405.2001. PMC 6763155. PMID 11487664.
- International Commission on Non-Ionizing Radiation Protection. (July 2013). "ICNIRP guidelines on limits of exposure to incoherent visible and infrared radiation" (PDF). Health Physics. 105 (1): 74–96.