2018 Alberta municipal censuses
Alberta has provincial legislation allowing its municipalities to conduct municipal censuses between April 1 and June 30 inclusive.[1][2] Municipalities choose to conduct their own censuses for multiple reasons such as to better inform municipal service planning and provision, to capitalize on per capita based grant funding from higher levels of government, or to simply update their populations since the last federal census.[3]
| ||
|
| ||
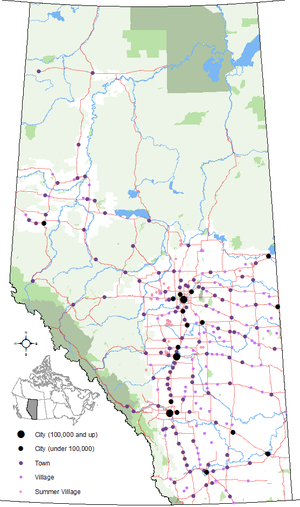 Distribution of Alberta's 269 urban municipalities | ||
Alberta began the year of 2018 with 352 municipalities.[4] Of these, at least 30 (8.5%) conducted a municipal census in 2018. Alberta Municipal Affairs recognized those conducted by 29 of these municipalities.[5] By municipal status, it recognized those conducted by 9 of Alberta's 18 cities, 11 of 109 towns, 4 of 86 villages, 3 of its 6 specialized municipalities, 1 of 63 municipal districts, and 1 of its 8 improvement districts.[5][lower-alpha 1]
Some municipalities achieved population milestones as a result of their 2018 censuses. Blackfalds exceeded 10,000 residents, making it eligible for city status, while the Municipal District of Greenview No. 16 grew beyond the 6,000 mark for the first time.
Municipal census results
The following summarizes the results of the numerous municipal censuses conducted in 2018.
| 2018 municipal census summary[5] | 2016 federal census comparison[6] | Previous municipal census comparison[7][8][9] | |||||||||
|---|---|---|---|---|---|---|---|---|---|---|---|
| Municipality | Status | Census date |
2018 pop. |
2016 pop. |
Absolute growth |
Absolute change |
Annual growth rate |
Prev. pop. |
Prev. census year |
Absolute growth |
Annual growth rate |
| Airdrie | City | April 1, 2018 | 68,091 | 61,581 | 6,510 | 10.6% | 5.2% | 64,922 | 2017 | 3,169 | 4.9% |
| Beaumont | Town | May 1, 2018 | 18,829 | 17,396 | 1,433 | 8.2% | 4.0% | 18,320 | 2017 | 509 | 2.8% |
| Blackfalds | Town | May 15, 2018 | 10,125 | 9,328 | 797 | 8.5% | 4.2% | 9,916 | 2017 | 209 | 2.1% |
| Boyle | Village | June 4, 2018 | 925 | 845 | 80 | 9.5% | 4.6% | 918 | 2009 | 7 | 0.1% |
| Bruderheim | Town | April 1, 2018 | 1,395 | 1,308 | 87 | 6.7% | 3.3% | 1,348 | 2014 | 47 | 0.9% |
| Calgary | City | April 1, 2018 | 1,267,344 | 1,239,220 | 28,124 | 2.3% | 1.1% | 1,246,337 | 2017 | 21,007 | 1.7% |
| Cardston | Town | June 18, 2018 | 3,909 | 3,585 | 324 | 9% | 4.4% | 3,578 | 2007 | 331 | 0.8% |
| Chestermere | City | May 1, 2018 | 20,732 | 19,887 | 845 | 4.2% | 2.1% | 20,331 | 2017 | 401 | 2.0% |
| Coalhurst | Town | May 22, 2018 | 2,767 | 2,668 | 99 | 3.7% | 1.8% | 2,522 | 2015 | 245 | 3.1% |
| Cochrane | Town | April 3, 2018 | 27,960 | 25,853 | 2,107 | 8.1% | 4.0% | 26,320 | 2017 | 1,640 | 6.2% |
| Crossfield | Town | May 1, 2018 | 3,308 | 2,983 | 325 | 10.9% | 5.3% | 3,055 | 2017 | 253 | 8.3% |
| Eckville | Town | May 24, 2018 | 1,163 | 1,125 | 38 | 3.4% | 1.7% | 1,002 | 2007 | 161 | 1.4% |
| Empress | Village | June 1, 2018 | 155 | 135 | 20 | 14.8% | 7.2% | 160[10] | 2017 | −5 | −3.1% |
| Fort Saskatchewan | City | April 2, 2018 | 26,328 | 24,149 | 2,179 | 9% | 4.4% | 25,533 | 2017 | 795 | 3.1% |
| Grande Prairie | City | April 16, 2018 | 69,088 | 63,166 | 5,922 | 9.4% | 4.6% | 68,556 | 2015 | 5,922 | 0.3% |
| MD of Greenview No. 16 | Municipal district | April 30, 2018 | 6,044 | 5,583 | 461 | 8.3% | 4.0% | 5,242 | 2013 | 802 | 2.9% |
| Improvement District No. 4 (Waterton) | Improvement district | June 22, 2018 | 108 | 105 | 3 | 2.9% | 1.4% | ||||
| Leduc | City | April 1, 2018 | 32,448 | 29,993 | 2,455 | 8.2% | 4.0% | 31,130 | 2017 | 1,318 | 4.2% |
| Lethbridge | City | April 1, 2018 | 99,769 | 92,729 | 7,040 | 7.6% | 3.7% | 98,198 | 2017 | 1,571 | 1.6% |
| Mackenzie County | Specialized municipality | April 18, 2018 | 12,512[11] | 11,171 | 1,341 | 12% | 5.8% | 11,750 | 2015 | 762 | 2.1% |
| Okotoks | Town | May 2, 2018 | 29,002 | 28,881 | 121 | 0.4% | 0.2% | 28,016 | 2015 | 986 | 1.2% |
| Raymond | Town | May 1, 2018 | 4,252 | 3,708 | 544 | 14.7% | 7.1% | 4,037 | 2017 | 215 | 5.3% |
| Rocky View County | Municipal district | 36,776[12][lower-alpha 2] | 39,407 | −2,631 | -6.7% | −3.4% | 38,055 | 2013 | −1,279 | −0.7% | |
| Spruce Grove | City | April 4, 2018 | 35,766 | 34,066 | 1,700 | 5% | 2.5% | 34,881 | 2017 | 885 | 2.5% |
| St. Albert | City | May 1, 2018 | 66,082 | 65,589 | 493 | 0.8% | 0.4% | 64,645 | 2016 | 1,437 | 1.1% |
| Stirling | Village | June 1, 2018 | 1,269 | 978 | 291 | 29.8% | 13.9% | 1,269 | 2017 | 0 | 0.0% |
| Strathcona County | Specialized municipality | May 1, 2018 | 98,381 | 98,044 | 337 | 0.3% | 0.2% | 95,597 | 2015 | 2,784 | 1.0% |
| Strathmore | Town | April 1, 2018 | 13,528 | 13,756 | −228 | -1.7% | −0.8% | 13,327 | 2015 | 201 | 0.5% |
| Waskatenau | Village | April 30, 2018 | 227 | 186 | 41 | 22% | 10.5% | 260 | 2000 | −33 | −0.8% |
| RM of Wood Buffalo | Specialized municipality | April 1, 2018 | 75,009 | 71,589 | 3,420 | 4.8% | 2.4% | 81,948 | 2015 | −6,939 | −2.9% |
Breakdowns
Urban and rural service areas
Strathcona County
| 2018 municipal census summary[13] | 2015 municipal census comparison[13] | |||
|---|---|---|---|---|
| Area | 2018 population |
Previous population |
Absolute growth |
Annual growth rate |
| Sherwood Park urban service area[lower-alpha 3] | 71,332 | 68,782 | 2,550 | 1.2% |
| Rural service area[lower-alpha 4] | 27,049 | 26,815 | 234 | 0.3% |
| Total Strathcona County | 98,381 | 95,597 | 2,784 | 1.0% |
Wood Buffalo
| 2018 municipal census summary[16] | 2015 municipal census comparison | |||
|---|---|---|---|---|
| Area | 2018 population |
Previous population |
Absolute growth |
Annual growth rate |
| Fort McMurray urban service area[lower-alpha 3] | 72,056 | 78,382 | −6,326 | −2.8% |
| Rural service area[lower-alpha 4] | 2,953 | 3,566 | −613 | −6.1% |
| Total RM of Wood Buffalo | 75,009 | 81,948 | −6,939 | −2.9% |
Hamlets
The following is a list of hamlet and other unincorporated community populations determined by the 2018 municipal censuses conducted by Rocky View County, Strathcona County and the Regional Municipality (RM) of Wood Buffalo excluding the urban service areas of Fort McMurray and Sherwood Park that are presented above.
| 2018 municipal census summary | Previous census comparison | |||||
|---|---|---|---|---|---|---|
| Hamlet/unincorporated community |
Municipality | 2018 population [12][17][16] |
Previous population [18][19] |
Previous census year |
Absolute growth |
Annual growth rate |
| Antler Lake | Strathcona County | 435 | 469 | 2015 | −34 | −2.5% |
| Anzac | RM of Wood Buffalo | 659 | 763 | 2015 | −104 | −4.8% |
| Ardrossan | Strathcona County | 532 | 412 | 2015 | 120 | 8.9% |
| Bottrel | Rocky View County | 5 | ||||
| Bragg Creek | Rocky View County | 459 | 454 | 2013 | 5 | 0.2% |
| Cochrane Lake | Rocky View County | 769 | 792 | 2013 | −23 | −0.6% |
| Collingwood Cove | Strathcona County | 376 | 360 | 2015 | 16 | 1.5% |
| Conklin | RM of Wood Buffalo | 229 | 376 | 2015 | −147 | −15.2% |
| Conrich | Rocky View County | 21 | 26 | 2013 | −5 | −4.2% |
| Dalemead | Rocky View County | 29 | 27 | 2013 | 2 | 1.4% |
| Dalroy | Rocky View County | 46 | 50 | 2013 | −4 | −1.7% |
| Delacour | Rocky View County | 10 | ||||
| Fort Chipewyan | RM of Wood Buffalo | 918 | 1,014 | 2015 | −96 | −3.3% |
| Fort MacKay | RM of Wood Buffalo | 59 | 51 | 2015 | 8 | 5.0% |
| Gregoire Lake Estates | RM of Wood Buffalo | 204 | 232 | 2015 | −28 | −4.2% |
| Half Moon Lake | Strathcona County | 214 | 195 | 2015 | 19 | 3.1% |
| Harmony | Rocky View County | 249 | ||||
| Hastings Lake | Strathcona County | 104 | 87 | 2015 | 17 | 6.1% |
| Indus | Rocky View County | 32 | 36 | 2013 | −4 | −2.3% |
| Janvier | RM of Wood Buffalo | 141 | 155 | 2015 | −14 | −2.3% |
| Josephburg | Strathcona County | 118 | 117 | 2015 | 1 | 0.3% |
| Kathyrn | Rocky View County | 13 | 20 | 2013 | −7 | −8.3% |
| Keoma | Rocky View County | 89 | 85 | 2013 | 4 | 0.9% |
| Langdon | Rocky View County | 5,364 | 4,897 | 2013 | 467 | 1.8% |
| Madden | Rocky View County | 26 | 21 | 2013 | 5 | 4.4% |
| North Cooking Lake | Strathcona County | 57 | 59 | 2015 | −2 | −1.1% |
| Saprae Creek | RM of Wood Buffalo | 715 | 977 | 2015 | −262 | −9.9% |
| South Cooking Lake | Strathcona County | 270 | 302 | 2015 | −32 | −3.7% |
Shadow population counts
Alberta Municipal Affairs defines shadow population as "temporary residents of a municipality who are employed by an industrial or commercial establishment in the municipality for a minimum of 30 days within a municipal census year."[3] Improvement District No. 4 (Wateron) and the RM of Wood Buffalo conducted shadow population counts in 2018. The following presents the results of these counts for comparison with their concurrent municipal census results.
| Municipality | Status | Municipal census population[5] |
Shadow population[5] |
Combined population[5] |
|---|---|---|---|---|
| Improvement District No. 4 (Wateron) | Improvement district | 108 | 405 | 513 |
| RM of Wood Buffalo | Specialized municipality | 75,009 | 36,678 | 111,687 |
See also
Notes
- No censuses were conducted among Alberta's 3 special areas and 51 summer villages.[5]
- Rocky View County was unable to enumerate 1,455 or 9.8% of its 14,791 dwellings in its 2018 municipal census. Rocky View extrapolated its results to an estimated population of 40,705.[12]
- The Fort McMurray and Sherwood Park urban service areas are deemed equivalents of cities.[14][15]
- Strathcona County's and the RM of Wood Buffalo's rural service areas are deemed equivalents of municipal districts.[14][15]
References
- "Municipal Government Act: Revised Statutes of Alberta 2000 Chapter M-26 (Office Consolidation)" (PDF). Alberta Queen's Printer. July 1, 2018. Retrieved July 28, 2018.
- "Municipal Government Act: Determination of Population Regulation, Alberta Regulation 63/2001 (Office Consolidation)" (PDF). Alberta Queen's Printer. 2017. p. 3. Retrieved July 28, 2018.
- "Municipal Census Manual: Requirements and Guidelines for Conducting a Municipal Census" (PDF). Alberta Municipal Affairs. February 2018. p. 8. ISBN 978-1-4601-3770-3. Retrieved July 28, 2018.
- "2018 Municipal Codes" (PDF). Alberta Municipal Affairs. April 20, 2018. Retrieved July 27, 2018.
- "2018 Municipal Affairs Population List" (PDF). Alberta Municipal Affairs. December 2018. ISBN 978-1-4601-4254-7. Retrieved December 20, 2018.
- "Population and dwelling counts, for Canada, provinces and territories, and census subdivisions (municipalities), 2016 and 2011 censuses – 100% data (Alberta)". Statistics Canada. February 8, 2018. Retrieved July 28, 2018.
- "2017 Municipal Affairs Population List" (PDF). Alberta Municipal Affairs. ISBN 978-1-4601-3652-2. Retrieved July 28, 2018.
- "2011 Municipal Affairs Population List" (PDF). Alberta Municipal Affairs. October 5, 2011. ISBN 978-0-7785-9738-4. Retrieved July 28, 2018.
- "2001 Official Population List" (PDF). Alberta Municipal Affairs. September 4, 2001. Retrieved December 23, 2018.
- "2017 Municipal Census". Village of Empress. Archived from the original on January 14, 2018. Retrieved June 2, 2017.
- "2018 Municipal census" (PDF). Mackenzie County. August 29, 2018. p. 87. Retrieved September 3, 2018.
- "2018 Rocky View County Census Results" (PDF). Rocky View County. November 13, 2018. pp. 249–254. Retrieved November 10, 2018.
- "Census population results: Strathcona County historical population". Strathcona County. August 30, 2018. Retrieved September 3, 2018.
- "Order in Council 817/94" (PDF). Province of Alberta. December 21, 1994. p. 2. Retrieved December 29, 2013.
- "Order in Council 761/95" (PDF). Province of Alberta. December 6, 1995. pp. 2–3. Retrieved December 29, 2013.
- "census2018 Municipal Census Report" (PDF). Regional Municipality of Wood Buffalo. Retrieved March 9, 2019.
- "Census 2018 Results Report" (PDF). Strathcona County. August 30, 2018. pp. 3–4. Retrieved September 4, 2018.
- "Census 2015: Overall Results" (PDF). Strathcona County. p. 4. Retrieved June 1, 2016.
- "The Municipal Census 2015 Report" (PDF). Regional Municipality of Wood Buffalo. p. 50. Retrieved June 1, 2016.