2000 Sri Lankan parliamentary election
The elections were called by President Chandrika Kumaratunga for October 10, 2000.
| |||||||||||||||||||||||||||||||
All 225 seats to the Parliament of Sri Lanka 113 seats were needed for a majority | |||||||||||||||||||||||||||||||
|---|---|---|---|---|---|---|---|---|---|---|---|---|---|---|---|---|---|---|---|---|---|---|---|---|---|---|---|---|---|---|---|
| Turnout | 75.63% | ||||||||||||||||||||||||||||||
| |||||||||||||||||||||||||||||||
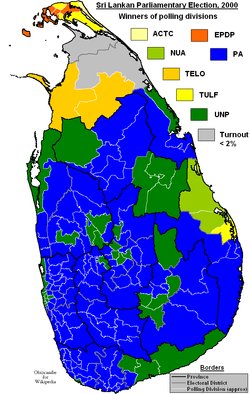 Winners of polling divisions. PA in blue and UNP in green. | |||||||||||||||||||||||||||||||
| |||||||||||||||||||||||||||||||
The People's Alliance (PA) government Kumaratunga had led for six years was facing increasing criticism on two fronts: a series of military defeats at the hands of the rebel Liberation Tigers of Tamil Eelam in the country's civil war, and the faltering performance of the economy.
The elections were marred by violence. Seventy people were killed during the campaign, including six on election day itself. . Both the UNP and SLMC parties accused the PA of election fraud and intimidation.
As was the case for most elections since 1983, few ballots were cast in LTTE-held parts of the country.
Results
The PA remained in office but lost its majority. The resulting deadlock led to the 2001 election.
Summary
Summary of the 2000 Sri Lankan parliamentary election[1][2]
| Alliances and parties | Votes | % | Seats | |||
|---|---|---|---|---|---|---|
| District | National | Total | ||||
| People's Alliance | 3,900,901 | 45.11% | 94 | 13 | 107 | |
United National Party
|
3,477,770 | 40.22% | 77 | 12 | 89 | |
| Janatha Vimukthi Peramuna | 518,774 | 6.00% | 8 | 2 | 10 | |
| Tamil United Liberation Front | 106,033 | 1.23% | 5 | 0 | 5 | |
| National Unity Alliance | 197,983 | 2.29% | 3 | 1 | 4 | |
| Eelam People's Democratic Party | 50,890 | 0.59% | 4 | 0 | 4 | |
| Tamil Eelam Liberation Organization | 26,112 | 0.30% | 3 | 0 | 3 | |
| Sinhala Heritage | 127,863 | 1.48% | 0 | 1 | 1 | |
| Independents | 67,288 | 0.78% | 1 | 0 | 1 | |
| All Ceylon Tamil Congress | 27,323 | 0.32% | 1 | 0 | 1 | |
| New Left Front | 32,275 | 0.37% | 0 | 0 | 0 | |
| Ceylon Workers' Congress[lower-alpha 2] | 23,013 | 0.27% | 0 | 0 | 0 | |
| Democratic People's Liberation Front | 20,848 | 0.24% | 0 | 0 | 0 | |
| Others | 70,595 | 0.82% | 0 | 0 | 0 | |
| Valid Votes | 8,647,668 | 100.00% | 196 | 29 | 225 | |
| Rejected Votes | 481,155 | |||||
| Total Polled | 9,128,823 | |||||
| Registered Electors | 12,071,062 | |||||
| Turnout | 75.63% | |||||
Electoral District
Results of the 2000 Sri Lankan general election by electoral district
Elected members
Notes
- SLMC contested with the PA in two districts (Ampara and Trincomalee) and with the NUA in all other districts.
- CWC contested with the PA in three districts (Kurunegala, Nuwara Eliya and Ratnapura) and separately in all other districts.
References
- "Parliamentary General Election 2000 - All Island Result". Department of Elections, Sri Lanka.
- "Parliamentary General Election 2000 - Composition of Parliament". Department of Elections, Sri Lanka. Archived from the original on 2010-08-26. Retrieved 2010-10-03.
- "Parliamentary General Election 2000 – All Island Result Composition of Parliament". Department of Elections, Sri Lanka. Archived from the original on 2010-08-26.
- "Parliamentary General Election 2000 – All Island Result". Department of Elections, Sri Lanka. Archived from the original on 2012-12-19.
- "Parliamentary General Election 10.10.2000 – Final District Results". Department of Elections, Sri Lanka. Archived from the original on 2012-08-05.
- "General Election 2000 Preferences" (PDF). Department of Elections, Sri Lanka. Archived from the original (PDF) on 2010-08-26.
- "2000 General Election Results". LankaNewspapers.com.
- "Table 41 Parliament Election (Electoral District) (2000)". Sri Lanka Statistics. 10 February 2009.
- "Sri Lanka Parliamentary Chamber: Parliament Elections Held in 2000". Inter-Parliamentary Union.
- "2000 - Parliamentary General Election". Manthree.com.
- "REPUBLIC OF SRI LANKA PARLIAMENTARY ELECTIONS OF 12 OCTOBER 2000". Psephos - Adam Carr's Election Archive.
- "REPUBLIC OF SRI LANKA PARLIAMENTARY ELECTIONS OF 12 OCTOBER 2000". Psephos - Adam Carr's Election Archive.
| Presidential elections | |
|---|---|
| Parliamentary elections | |
| Provincial elections |
|
| Local elections | |
| Referendums | |