2000 Azorean regional election
The Azores Regional Election, 2000 (Portuguese: Eleições Regionais dos Açores, 2000) was an election held on 15 October 2000 for the legislative assembly and government of the Portuguese autonomous region of the Azores, in which the Socialist Party, under the leadership of Carlos César received 49% of the votes, and got an absolute majority, in comparison to their direct rivals, the Social Democratic Party with 32%. Voter turnout was the lowest til then with just 53.3% of the electorate casting their ballot on election day.
| |||||||||||||||||||||||||||||||
52 seats to the Legislative Assembly of Azores 27 seats needed for a majority | |||||||||||||||||||||||||||||||
|---|---|---|---|---|---|---|---|---|---|---|---|---|---|---|---|---|---|---|---|---|---|---|---|---|---|---|---|---|---|---|---|
| |||||||||||||||||||||||||||||||
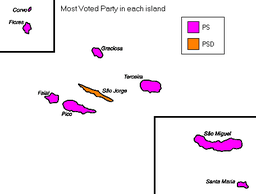 Map of Azores showing constituencies won | |||||||||||||||||||||||||||||||
| |||||||||||||||||||||||||||||||


Background
In the Azores, there were 52 seats in the Regional Parliament in dispute, the same of the previous election, in 1996. The seats were distributed by the 9 islands of the archipelago proportionally to the population of each island; however, each island is entitled to at least two members of parliament.
Issues
Political parties
The political parties, movements and alliances during these elections mirrored many of the parties that appeared in the national legislative and/or European elections of that year, but specifically included the following:
- Left Bloc (BE)
- People's Monarchist Party-Democratic Party of the Atlantic (PPM-PDA), actually two independent parties; the PPM and PDA, ran as a coalition; leaders of each party: Miguel Pignatelli Queirós (PPM) and Joaquim de Aguiar Cabral (PDA)
- People's Party (CDS–PP);
- Socialist Party (PS);
- Social Democratic Party (PSD), leader Alberto Madruga da Costa
- Unitarian Democratic Coalition (CDU), is a coalition between the Portuguese Communist Party (PCP) Açores and the Greens (PEV)[1]
Results
For a second term, the Socialist Party won the regional election in Azores, increasing its share of the vote from 30% to 49%, and re-electing Carlos César to the presidency of the Regional Government. Many of the Social Democrat's mandates were lost, while César and his teram obtained an absolute majority with 30 of the assembly's 52 seats.
The Social Democrats, who had dominated the politics of the islands since the Carnation Revolution lost almost 10% of the vote, and six MPs. The People's Party (CDS), despite raising their share of the vote (by more than 2%), lost one of their representatives, due to the application of the Hondt election model in the nine islands. The People's Monarchist Party, which had not participated in the previous election, ran in coalition with the Democratic Party of the Atlantic, but were unsuccessful in obtaining any representation. The Unitarian Democratic Coalition (CDU), led by the Portuguese Communist Party (PCP) raised their popular vote by 1%, achieving another deputy (on the island of Faial).
After aligning itself with many of the smaller left-of-centre parties, the People's Democratic Union (UDP), elements of the party merged with the Left Bloc, but did not achieve any representation.
Summary of votes and seats
| Parties | Votes | % | ±pp swing | MPs | MPs %/ votes % | |||||
|---|---|---|---|---|---|---|---|---|---|---|
| 1996 | 2000 | ± | % | ± | ||||||
| Socialist | 49,438 | 49.20 | 24 | 30 | 57.69 | 1.17 | ||||
| Social Democratic | 32,642 | 32.48 | 24 | 18 | 34.62 | 1.07 | ||||
| People's | 9,605 | 9.56 | 3 | 2 | 3.85 | 0.40 | ||||
| Democratic Unity Coalition | 4,856 | 4.83 | 1 | 2 | 3.85 | 0.80 | ||||
| Left Bloc | 1,387 | 1.38 | — | — | 0 | — | 0.00 | — | 0.0 | |
| PPM / PDA | 799 | 0.80 | — | — | 0 | — | 0.00 | — | 0.0 | |
| Total valid | 98,727 | 98.25 | 52 | 52 | 100.00 | — | ||||
| Blank ballots | 895 | 0.89 | ||||||||
| Invalid ballots | 862 | 0.86 | ||||||||
| Total (turnout 53.30%) | 100,484 | 100.00 | ||||||||
| Source: Comissão Nacional de Eleições | ||||||||||
Distribution by constituency
| Constituency | % | S | % | S | % | S | % | S | Total S |
|---|---|---|---|---|---|---|---|---|---|
| PS | PSD | CDS-PP | CDU | ||||||
| Corvo | 32.5 | 1 | 31.8 | 1 | 31.1 | - | 2 | ||
| Faial | 35.4 | 2 | 30.2 | 1 | 3.8 | - | 27.8 | 1 | 4 |
| Flores | 26.9 | 1 | 26.8 | 1 | 21.8 | - | 21.9 | 1 | 3 |
| Graciosa | 51.4 | 2 | 42.0 | 1 | 3.2 | - | 1.1 | - | 3 |
| Pico | 45.4 | 2 | 44.2 | 2 | 5.7 | - | 1.9 | - | 4 |
| Santa Maria | 65.7 | 2 | 24.5 | 1 | 5.0 | - | 1.4 | - | 3 |
| São Jorge | 34.0 | 2 | 45.4 | 2 | 15.5 | - | 1.3 | - | 4 |
| São Miguel | 53.3 | 12 | 30.1 | 6 | 8.7 | 1 | 3.2 | - | 19 |
| Terceira | 49.5 | 6 | 32.2 | 3 | 12.8 | 1 | 2.3 | - | 10 |
| Total | 49.2 | 30 | 32.4 | 18 | 9.6 | 2 | 4.8 | 2 | 52 |
| Source: Comissão Nacional de Eleições | |||||||||
References
- Carlos Pamplona de Oliveira, ed. (20 May 2009). "Acórdão N.º255/09" (in Portuguese). Lisbon, Portugal: Tribunal Constitucional. Retrieved 11 October 2009.