1999 Offaly County Council election
An election to Offaly County Council took place on 10 June 1999 as part of that year's Irish local elections. 21 councillors were elected from five electoral divisions by PR-STV voting for a five-year term of office.
| |||||||||||||||||||||||||||||||||
All 21 seats to Offaly County Council | |||||||||||||||||||||||||||||||||
|---|---|---|---|---|---|---|---|---|---|---|---|---|---|---|---|---|---|---|---|---|---|---|---|---|---|---|---|---|---|---|---|---|---|
| |||||||||||||||||||||||||||||||||
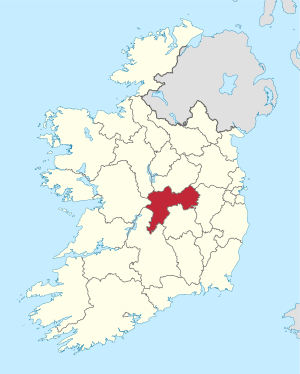 Map showing the area of Offaly County Council | |||||||||||||||||||||||||||||||||
| |||||||||||||||||||||||||||||||||
Results by party
| Party | Seats | ± | First Pref. votes | FPv% | ±% | |
|---|---|---|---|---|---|---|
| Fianna Fáil | 9 | -1 | 9,880 | 38.14% | ||
| Fine Gael | 7 | +1 | 6,879 | 26.56% | ||
| Labour Party | 1 | - | 2,366 | 9.13% | ||
| Independent | 4 | +1 | 6,340 | 24.48% | ||
| Progressive Democrats | 0 | -1 | - | - | ||
| Totals | 21 | - | 25,904 | 100% | — | |
Results by Electoral Area
Birr
| Birr- 5 seats | ||||||||||
|---|---|---|---|---|---|---|---|---|---|---|
| Party | Candidate | FPv% | Count 1 | Count 2 | Count 3 | Count 4 | Count 5 | Count 6 | ||
| Fine Gael | Olwyn Enright | 16.61 | 1,064 | |||||||
| Independent | Peter Ormond | 15.27 | 978 | 982 | 1,073 | |||||
| Fine Gael | Percy Clendennen* | 14.92 | 956 | 963 | 985 | 1,185 | ||||
| Fianna Fáil | Senator Pat Moylan* | 12.94 | 829 | 877 | 930 | 1,089 | ||||
| Independent | John Carroll | 9.12 | 584 | 597 | 610 | 641 | 665 | 883 | ||
| Fianna Fáil | Joe Dooley* | 8.65 | 554 | 632 | 732 | 747 | 762 | 937 | ||
| Independent | Tony McLoughlin | 7.63 | 489 | 519 | 529 | 532 | 554 | |||
| Fine Gael | Tom Rigney | 7.02 | 450 | 451 | 455 | |||||
| Fianna Fáil | Una Collison | 4.40 | 282 | 297 | ||||||
| Fianna Fáil | James McNamara | 3.43 | 220 | |||||||
| Electorate: 10,685 Valid: 6,406 (59.95%) Spoilt: 85 Quota: 1,068 Turnout: 6,491 (60.75%) | ||||||||||
Edenderry
| Edenderry - 5 seats | ||||||||||||
|---|---|---|---|---|---|---|---|---|---|---|---|---|
| Party | Candidate | FPv% | Count 1 | Count 2 | Count 3 | Count 4 | Count 5 | Count 6 | Count 7 | Count 8 | ||
| Fianna Fáil | Noel Bourke* | 26.54 | 1,465 | |||||||||
| Fianna Fáil | Ger Killally | 21.42 | 1,182 | |||||||||
| Independent | Frank Weir* | 9.13 | 504 | 533 | 553 | 563 | 583 | 637 | 702 | 782 | ||
| Fianna Fáil | Tom Nolan | 8.04 | 444 | 617 | 718 | 721 | 742 | 769 | 866 | 933 | ||
| Fine Gael | Emma Jones | 7.56 | 417 | 427 | 431 | 437 | 444 | 463 | ||||
| Fine Gael | Geraldine McGarrigle | 6.58 | 363 | 378 | 403 | 404 | 409 | 477 | 581 | |||
| Fine Gael | John Foran | 6.12 | 338 | 399 | 415 | 420 | 475 | 507 | 639 | 871 | ||
| Independent | Fergus McDonnell | 5.98 | 330 | 473 | 499 | 506 | 590 | 626 | 636 | 656 | ||
| Independent | Peter McNamee | 5.00 | 276 | 282 | 323 | 338 | 352 | |||||
| Independent | Tom O'Connell | 2.77 | 153 | 254 | 275 | 282 | ||||||
| Independent | John Owens | 0.85 | 47 | 54 | 62 | |||||||
| Electorate: 10,302 Valid: 5,519 (53.57%) Spoilt: 82 Quota: 920 Turnout: 5,601 (54.37%) | ||||||||||||
Ferbane
| Ferbane- 4 seats | ||||||||||
|---|---|---|---|---|---|---|---|---|---|---|
| Party | Candidate | FPv% | Count 1 | Count 2 | Count 3 | Count 4 | Count 5 | Count 6 | ||
| Fine Gael | Connie Hanniffy* | 23.46 | 1,066 | |||||||
| Fianna Fáil | Eamon Dooley* | 22.32 | 1,014 | |||||||
| Fianna Fáil | Tom Feighery* | 16.00 | 727 | 744 | 818 | 867 | 1,011 | |||
| Labour Party | Timmy Molloy | 12.52 | 569 | 583 | 588 | 650 | 727 | 750 | ||
| Fine Gael | Marcella Corcoran Kennedy | 10.54 | 479 | 573 | 588 | 635 | 806 | 859 | ||
| Independent | Padraig Horan | 8.47 | 385 | 411 | 419 | 510 | ||||
| Independent | Christy Gannon | 6.67 | 303 | 309 | 312 | |||||
| Electorate: 8,994 Valid: 4,543 (50.51%) Spoilt: 366 Quota: 909 Turnout: 4,909 (54.58%) | ||||||||||
Tullamore
| Tullamore - 7 seats | ||||||||||||||||
|---|---|---|---|---|---|---|---|---|---|---|---|---|---|---|---|---|
| Party | Candidate | FPv% | Count 1 | Count 2 | Count 3 | Count 4 | Count 5 | Count 6 | Count 7 | Count 8 | Count 9 | Count 10 | Count 11 | Count 12 | ||
| Labour Party | Pat Gallagher* | 16.70 | 1,591 | |||||||||||||
| Fianna Fáil | Barry Cowen* | 11.96 | 1,139 | 1,154 | 1,159 | 1,188 | 1,274 | |||||||||
| Fine Gael | Tommy McKeigue* | 8.48 | 808 | 865 | 871 | 947 | 962 | 963 | 1,042 | 1,070 | 1,096 | 1,141 | 1,224 | |||
| Fianna Fáil | John Flanagan* | 8.44 | 804 | 836 | 846 | 851 | 913 | 954 | 996 | 1,018 | 1,155 | 1,181 | 1,521 | |||
| Fine Gael | Michael Fox* | 7.19 | 685 | 701 | 702 | 734 | 775 | 784 | 812 | 819 | 854 | 870 | 909 | 944 | ||
| Independent | Thomas Dolan* | 6.76 | 644 | 652 | 662 | 692 | 699 | 700 | 716 | 803 | 818 | 1,036 | 1,052 | 1,071 | ||
| Independent | Molly Buckley | 6.37 | 607 | 643 | 648 | 663 | 690 | 694 | 760 | 789 | 807 | 870 | 949 | 986 | ||
| Independent | Johnny Butterfield* | 5.65 | 538 | 553 | 566 | 572 | 582 | 584 | 606 | 626 | 768 | 792 | 827 | 864 | ||
| Fianna Fáil | Michael Mahon | 4.78 | 455 | 462 | 468 | 471 | 496 | 505 | 510 | 520 | ||||||
| Sinn Féin | Oliver O'Connor | 4.61 | 439 | 446 | 449 | 458 | 461 | 462 | 485 | |||||||
| Independent | Frank Feery | 4.55 | 433 | 446 | 446 | 478 | 483 | 485 | 511 | 580 | 584 | |||||
| Fianna Fáil | Miriam O'Callaghan* | 4.53 | 432 | 461 | 464 | 473 | 513 | 525 | 571 | 595 | 696 | 726 | ||||
| Fianna Fáil | Vincent Bermingham | 3.50 | 333 | 339 | 341 | 342 | ||||||||||
| Labour Party | Seán O'Brien | 3.11 | 296 | 443 | 444 | 452 | 457 | 458 | ||||||||
| Fine Gael | Brendan McGowan | 2.66 | 253 | 264 | 265 | |||||||||||
| Independent | John Conroy | 0.72 | 69 | 70 | ||||||||||||
| Electorate: 17,384 Valid: 9,526 (54.80%) Spoilt: 159 Quota: 1,191 Turnout: 9,685 (55.71%) | ||||||||||||||||
External links
| Preceded by 1991 Offaly County Council election |
Offaly County Council elections | Succeeded by 2004 Offaly County Council election |
This article is issued from Wikipedia. The text is licensed under Creative Commons - Attribution - Sharealike. Additional terms may apply for the media files.