1998 Derby City Council election
The 1998 Derby City Council election took place on 7 May 1998 to elect members of Derby City Council in England. One third of the council was up for election and the Labour party kept overall control of the council.[3]
| |||||||||||||||||||||||||||||
14 of the 44 seats in the Derby City Council 23 seats needed for a majority | |||||||||||||||||||||||||||||
|---|---|---|---|---|---|---|---|---|---|---|---|---|---|---|---|---|---|---|---|---|---|---|---|---|---|---|---|---|---|
| |||||||||||||||||||||||||||||
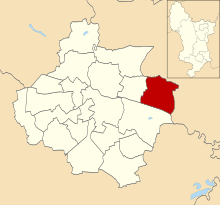
 Map showing the results of the 1998 Derby City Council elections. | |||||||||||||||||||||||||||||
| |||||||||||||||||||||||||||||
One of the two Labour councillors defeated in the election was Milton Crosdale, the father of Imaani, who was taking part in the Eurovision Song Contest for the United Kingdom two days after the election.[4] Crosdale had been defending a three-vote majority in Blagreaves ward.[4]
After the election, the composition of the council was
Election result
| Party | Seats | Gains | Losses | Net gain/loss | Seats % | Votes % | Votes | +/− | |
|---|---|---|---|---|---|---|---|---|---|
| Labour | 10 | 0 | 2 | 71.4 | 48.8 | 16,936 | |||
| Conservative | 3 | 1 | 0 | 21.4 | 34.1 | 11,821 | |||
| Liberal Democrats | 1 | 1 | 0 | 7.1 | 16.0 | 5,548 | |||
| National Democrats | 0 | 0 | 0 | 0.0 | 0.4 | 125 | |||
| Green | 0 | 0 | 0 | 0.0 | 0.4 | 123 | |||
| Independent | 0 | 0 | 0 | 0.0 | 0.3 | 121 | |||
Ward results
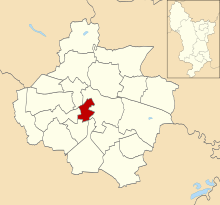
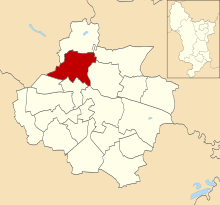
Abbey
Location of Abbey ward
| Party | Candidate | Votes | % | |
|---|---|---|---|---|
| Labour | J. Till | 1,191 | 67.3% | |
| Conservative | D. Sice | 365 | 20.6% | |
| Liberal Democrats | B. Harry | 215 | 12.1% | |
| Turnout | 15.4% | |||
| Labour hold | ||||
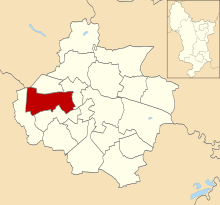
Allestree
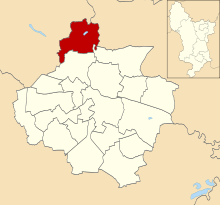
Location of Allestree ward
| Party | Candidate | Votes | % | |
|---|---|---|---|---|
| Conservative | R. Webb | 1,666 | 63.2% | |
| Labour | M. Musih-Ud Daullah | 601 | 22.8% | |
| Liberal Democrats | S. Kirkman King | 368 | 14.0% | |
| Turnout | 32.7% | |||
| Conservative hold | ||||
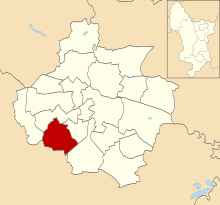
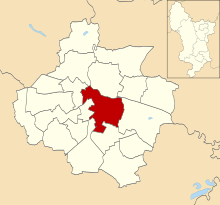
Alvaston
Location of Alvaston ward
| Party | Candidate | Votes | % | |
|---|---|---|---|---|
| Labour | N. Wawman | 1,077 | 61.3% | |
| Conservative | P. Willitts | 427 | 24.3% | |
| Liberal Democrats | T. Hall | 171 | 9.7% | |
| National Democrats | G. Hardy | 81 | 4.6% | |
| Turnout | 22.8% | |||
| Labour hold | ||||
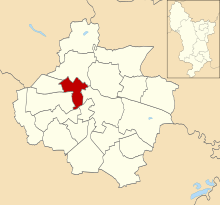
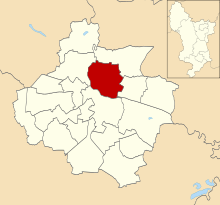
Babington
Location of Babington ward
| Party | Candidate | Votes | % | |
|---|---|---|---|---|
| Labour | V. Wilsoncroft | 903 | 52.5% | |
| Conservative | M. Yaqub | 595 | 34.6% | |
| Liberal Democrats | A. Savage | 223 | 13.0% | |
| Turnout | 23.3% | |||
| Labour hold | ||||
Blagreaves
Location of Blagreaves ward
| Party | Candidate | Votes | % | |
|---|---|---|---|---|
| Liberal Democrats | R. Skelton | 2,409 | 58.4% | |
| Labour | M. Crosdale | 1,314 | 31.8% | |
| Conservative | J. Lee | 361 | 8.7% | |
| National Democrats | K. Sharp | 44 | 1.1% | |
| Turnout | 45.2% | |||
| Liberal Democrats gain from Labour | ||||
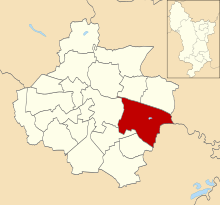
Boulton
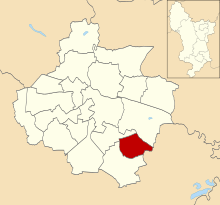
Location of Boulton ward
| Party | Candidate | Votes | % | |
|---|---|---|---|---|
| Labour | H. Dhindsa | 1,190 | 56.5% | |
| Conservative | J. Slater | 683 | 32.4% | |
| Liberal Democrats | R. Charlesworth | 234 | 11.1% | |
| Turnout | 25.1% | |||
| Labour hold | ||||
Breadsall

Location of Breadsall ward
| Party | Candidate | Votes | % | |
|---|---|---|---|---|
| Labour | J. Ireland | 1,807 | 51.3% | |
| Conservative | M. Webb | 1,363 | 38.7% | |
| Liberal Democrats | E. Ashburner | 349 | 9.9% | |
| Turnout | 22.4% | |||
| Labour hold | ||||
Chaddesden
Location of Chaddesden ward
| Party | Candidate | Votes | % | |
|---|---|---|---|---|
| Labour | M. Repton | 1,323 | 60.1% | |
| Conservative | J. Veitch | 600 | 27.3% | |
| Liberal Democrats | P. Whitaker | 156 | 7.1% | |
| Independent | L. Alcock | 121 | 5.5% | |
| Turnout | 27.0% | |||
| Labour hold | ||||
Chellaston
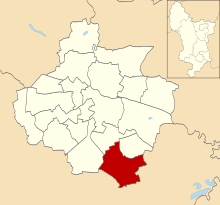
Location of Chellaston ward
| Party | Candidate | Votes | % | |
|---|---|---|---|---|
| Labour | B. Jackson | 1,492 | 51.4% | |
| Conservative | D. Black | 1,209 | 41.7% | |
| Liberal Democrats | B. Lowe | 199 | 6.9% | |
| Turnout | 29.4% | |||
| Labour hold | ||||
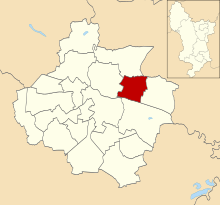
Darley
Location of Darley ward
| Party | Candidate | Votes | % | |
|---|---|---|---|---|
| Conservative | P. Latham | 1,647 | 48.5% | |
| Labour | D. Roberts | 1,375 | 40.5% | |
| Liberal Democrats | J-P. Keane | 377 | 11.1% | |
| Turnout | 36.1% | |||
| Conservative gain from Labour | ||||
Derwent
Location of Derwent ward
| Party | Candidate | Votes | % | |
|---|---|---|---|---|
| Labour | M. Young | 1,067 | 70.2% | |
| Conservative | J. Thorpe | 301 | 19.8% | |
| Liberal Democrats | J. Whitaker | 151 | 9.9% | |
| Turnout | 20.2% | |||
| Labour hold | ||||
Kingsway
Location of Kingsway ward
| Party | Candidate | Votes | % | |
|---|---|---|---|---|
| Labour | P. Hill | 979 | 45.0% | |
| Conservative | B. Maw | 862 | 39.7% | |
| Liberal Democrats | R. Troup | 333 | 15.3% | |
| Turnout | 27.2% | |||
| Labour hold | ||||
Litchurch
Location of Litchurch ward
| Party | Candidate | Votes | % | |
|---|---|---|---|---|
| Labour | A. Rehman | 1,158 | 73.1% | |
| Conservative | J. Magee | 222 | 14.0% | |
| Green | J. Macdonald | 123 | 7.8% | |
| Liberal Democrats | W. Savage | 81 | 5.1% | |
| Turnout | 22.0% | |||
| Labour hold | ||||
Spondon
Location of Spondon ward
| Party | Candidate | Votes | % | |
|---|---|---|---|---|
| Conservative | C. Brown | 1,520 | 46.6% | |
| Labour | R. Morgan | 1,459 | 44.7% | |
| Liberal Democrats | P. Peat | 282 | 8.6% | |
| Turnout | 33.3% | |||
| Conservative hold | ||||
References
- "Council compositions by year". The Elections Centre.
- "Local Election Summaries 1998". The Elections Centre.
- "Local Elections results". The Times. 9 May 1998. p. 46.
- "Father has the blues". Birmingham Post. 8 May 1998. p. 3.
- "Policy and politics: Local Elections: Analysis: Council poll results". The Guardian. 9 May 1998. p. 16.
- "Derby City Council Election Results 1996-2012" (PDF). Elections Centre.
| Derbyshire County Council | |
|---|---|
| Amber Valley Borough Council | |
| Bolsover District Council | |
| Chesterfield Borough Council | |
| Derby City Council | |
| Derbyshire Dales District Council | |
| Erewash Borough Council | |
| High Peak Borough Council | |
| North East Derbyshire District Council | |
| South Derbyshire District Council |
|
| |
This article is issued from Wikipedia. The text is licensed under Creative Commons - Attribution - Sharealike. Additional terms may apply for the media files.