1992 Schleswig-Holstein state election
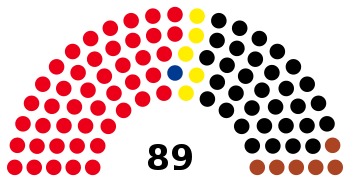
The 1992 Schleswig-Holstein state election was held on 5 April 1992 to elect the members of the Landtag of Schleswig-Holstein. The incumbent Social Democratic Party (SPD) government led by Minister-President Björn Engholm narrowly retained its majority by a margin of one seat. The major change of the election was the entry of the national conservative German People's Union to the Landtag. The Free Democratic Party also re-entered the Landtag, while The Greens failed to surpass the threshold by a margin of 0.03%.
| |||||||||||||||||||||||||||||||||||||||||||||||||||||||||||||||||||||||||
All 89 seats in the Landtag of Schleswig-Holstein 45 seats needed for a majority | |||||||||||||||||||||||||||||||||||||||||||||||||||||||||||||||||||||||||
|---|---|---|---|---|---|---|---|---|---|---|---|---|---|---|---|---|---|---|---|---|---|---|---|---|---|---|---|---|---|---|---|---|---|---|---|---|---|---|---|---|---|---|---|---|---|---|---|---|---|---|---|---|---|---|---|---|---|---|---|---|---|---|---|---|---|---|---|---|---|---|---|---|---|
| Turnout | 1,487,909 (71.7%) | ||||||||||||||||||||||||||||||||||||||||||||||||||||||||||||||||||||||||
| |||||||||||||||||||||||||||||||||||||||||||||||||||||||||||||||||||||||||
| |||||||||||||||||||||||||||||||||||||||||||||||||||||||||||||||||||||||||
Parties
The table below lists parties represented in the previous Landtag of Schleswig-Holstein.
| Name | Ideology | Leader(s) | 1988 result | |||
|---|---|---|---|---|---|---|
| Votes (%) | Seats | |||||
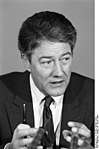
| SPD | Social Democratic Party of Germany Sozialdemokratische Partei Deutschlands |
Social democracy | Björn Engholm | 54.8% | 46 / 74 | |
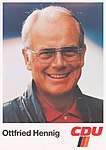
| CDU | Christian Democratic Union of Germany Christlich Demokratische Union Deutschlands |
Christian democracy | Ottfried Hennig | 33.3% | 27 / 74 | |
| SSW | South Schleswig Voters' Association Südschleswigscher Wählerverband |
Danish and Frisian minority interests | 1.7% | 1 / 74 | ||
Election result
Summary of the 5 April 1992 election results for the Landtag of Schleswig-Holstein
 | |||||||
| Party | Votes | % | +/- | Seats | +/- | Seats % | |
|---|---|---|---|---|---|---|---|
| Social Democratic Party (SPD) | 687,427 | 46.2 | 45 | 50.6 | |||
| Christian Democratic Union (CDU) | 503,510 | 33.8 | 32 | 36.0 | |||
| German People's Union (DVU) | 93,295 | 6.3 | 6 | 6.7 | |||
| Free Democratic Party (FDP) | 82,963 | 5.6 | 5 | 5.6 | |||
| South Schleswig Voters' Association (SSW) | 28,245 | 1.9 | 1 | ±0 | 1.1 | ||
| Alliance 90/The Greens (Grüne) | 74,014 | 5.0 | 0 | ±0 | 0 | ||
| The Republicans (REP) | 18,225 | 1.2 | 0 | ±0 | 0 | ||
| Others | 230 | 0.0 | 0 | ±0 | 0 | ||
| Total | 1,487,909 | 100.0 | 89 | ||||
| Voter turnout | 71.7 | ||||||
Sources
| State elections | |
|---|---|
| Local elections |
|
| |
This article is issued from Wikipedia. The text is licensed under Creative Commons - Attribution - Sharealike. Additional terms may apply for the media files.