1967 Dutch general election
General elections were held in the Netherlands on 15 February 1967.[1] The Catholic People's Party (KVP) remained the largest party, winning 42 of the 150 seats in the House of Representatives.[2]
| |||||||||||||||||||||||||||||||||||||||||||||||||||||||||||||
| Turnout | 94.9% | ||||||||||||||||||||||||||||||||||||||||||||||||||||||||||||
|---|---|---|---|---|---|---|---|---|---|---|---|---|---|---|---|---|---|---|---|---|---|---|---|---|---|---|---|---|---|---|---|---|---|---|---|---|---|---|---|---|---|---|---|---|---|---|---|---|---|---|---|---|---|---|---|---|---|---|---|---|---|
This lists parties that won seats. See the complete results below. | |||||||||||||||||||||||||||||||||||||||||||||||||||||||||||||
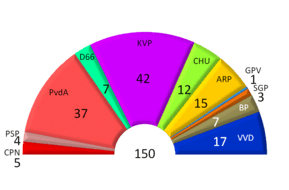 Seats | |||||||||||||||||||||||||||||||||||||||||||||||||||||||||||||
| |||||||||||||||||||||||||||||||||||||||||||||||||||||||||||||
The elections led to a four-party coalition government being formed, consisting of the KVP, People's Party for Freedom and Democracy, Anti-Revolutionary Party and Christian Historical Union.
Results
| Party | Votes | % | Seats | +/– |
|---|---|---|---|---|
| Catholic People's Party | 1,822,904 | 26.5 | 42 | –8 |
| Labour Party | 1,620,112 | 23.6 | 37 | –6 |
| People's Party for Freedom and Democracy | 738,202 | 10.7 | 17 | +1 |
| Anti-Revolutionary Party | 681,060 | 9.9 | 15 | +2 |
| Christian Historical Union | 560,033 | 8.1 | 12 | –1 |
| Farmers' Party | 327,953 | 4.8 | 7 | +4 |
| Democrats 1966 | 307,810 | 4.5 | 7 | New |
| Communist Party of the Netherlands | 248,318 | 3.6 | 5 | +1 |
| Pacifist Socialist Party | 197,206 | 2.9 | 4 | 0 |
| Reformed Political Party | 138,069 | 2.0 | 3 | 0 |
| Reformed Political League | 59,156 | 0.9 | 1 | 0 |
| The Emergency Council | 45,421 | 0.7 | 0 | New |
| Christian Democratic Union | 45,335 | 0.7 | 0 | New |
| Party for the Unmarried | 43,361 | 0.6 | 0 | New |
| Land Interests | 17,594 | 0.3 | 0 | New |
| Liberal People's Party | 11,279 | 0.2 | 0 | New |
| Voogd List | 4,808 | 0.1 | 0 | New |
| Van Breukelen-Grein List | 3,560 | 0.1 | 0 | New |
| Machiela List | 1,669 | 0.0 | 0 | New |
| Germeaux List | 1,218 | 0.0 | 0 | New |
| Party of the Right | 1,070 | 0.0 | 0 | New |
| Christian National People's Party | 976 | 0.0 | 0 | 0 |
| Rodermond List | 916 | 0.0 | 0 | New |
| Invalid/blank votes | 198,298 | – | – | – |
| Total | 7,076,328 | 100 | 150 | 0 |
| Registered voters/turnout | 7,452,776 | 94.9 | – | – |
| Source: Nederlandse verkiezingsuitslagen | ||||
References
- Dieter Nohlen & Philip Stöver (2010) Elections in Europe: A data handbook, p1396 ISBN 978-3-8329-5609-7
- Nohlen & Stöver, p1414
| General elections |
|
|---|---|
| Provincial elections | |
| Municipal elections | |
| European elections | |
| Water board elections |
|
| Referendums | |
| |
This article is issued from Wikipedia. The text is licensed under Creative Commons - Attribution - Sharealike. Additional terms may apply for the media files.