1895 Washington Senators season
The 1895 Washington Senators baseball team finished the season with a 43–85 record, tenth place in the National League.
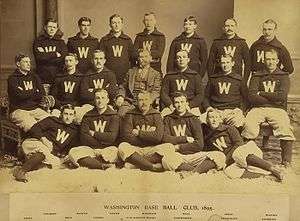
Team photograph
| 1895 Washington Senators | |
|---|---|
| Major League affiliations | |
| |
| Location | |
| |
| Other information | |
| Owner(s) | J. Earl Wagner |
| Manager(s) | Gus Schmelz |
| < Previous season Next season > | |
Regular season
Season standings
| National League | W | L | Pct. | GB | Home | Road |
|---|---|---|---|---|---|---|
| Baltimore Orioles | 87 | 43 | 0.669 | — | 54–12 | 33–31 |
| Cleveland Spiders | 84 | 46 | 0.646 | 3 | 49–13 | 35–33 |
| Philadelphia Phillies | 78 | 53 | 0.595 | 9½ | 51–21 | 27–32 |
| Chicago Colts | 72 | 58 | 0.554 | 15 | 43–24 | 29–34 |
| Brooklyn Grooms | 71 | 60 | 0.542 | 16½ | 43–22 | 28–38 |
| Boston Beaneaters | 71 | 60 | 0.542 | 16½ | 48–19 | 23–41 |
| Pittsburgh Pirates | 71 | 61 | 0.538 | 17 | 44–21 | 27–40 |
| Cincinnati Reds | 66 | 64 | 0.508 | 21 | 42–22 | 24–42 |
| New York Giants | 66 | 65 | 0.504 | 21½ | 40–27 | 26–38 |
| Washington Senators | 43 | 85 | 0.336 | 43 | 31–34 | 12–51 |
| St. Louis Browns | 39 | 92 | 0.298 | 48½ | 25–41 | 14–51 |
| Louisville Colonels | 35 | 96 | 0.267 | 52½ | 19–38 | 16–58 |
Record vs. opponents
1895 National League Records Sources: | |||||||||||||||||
|---|---|---|---|---|---|---|---|---|---|---|---|---|---|---|---|---|---|
| Team | BAL | BOS | BR | CHI | CIN | CLE | LOU | NYG | PHI | PIT | STL | WSH | |||||
| Baltimore | — | 10–2 | 7–5 | 8–4 | 8–4 | 5–6 | 10–1 | 9–3 | 8–4–1 | 7–5–1 | 6–6 | 9–3 | |||||
| Boston | 2–10 | — | 4–7 | 7–5 | 5–7 | 6–6 | 9–3–1 | 8–4 | 5–7 | 7–5 | 9–3 | 9–3–1 | |||||
| Brooklyn | 5–7 | 7–4 | — | 6–6 | 5–7 | 2–10 | 11–1 | 9–3–1 | 5–7–1 | 7–5–1 | 9–3 | 5–7 | |||||
| Chicago | 4–8 | 5–7 | 6–6 | — | 5–7 | 6–5 | 9–3–1 | 4–8 | 6–6 | 8–4 | 10–2 | 9–2–2 | |||||
| Cincinnati | 4–8 | 7–5 | 7–5 | 7–5 | — | 6–6 | 6–6 | 4–8 | 4–8 | 4–8–1 | 9–3–1 | 8–2 | |||||
| Cleveland | 6–5 | 6–6 | 10–2 | 5–6 | 6–6 | — | 10–2 | 7–5 | 7–5 | 7–5 | 11–1–2 | 9–3 | |||||
| Louisville | 1–10 | 3–9–1 | 1–11 | 3–9–1 | 6–6 | 2–10 | — | 3–9 | 2–10 | 2–10 | 6–6 | 6–6 | |||||
| New York | 3–9 | 4–8 | 3–9–1 | 8–4 | 8–4 | 5–7 | 9–3 | — | 3–8 | 4–8 | 11–1 | 8–4 | |||||
| Philadelphia | 4–8–1 | 7–5 | 7–5–1 | 6–6 | 8–4 | 5–7 | 10–2 | 8–3 | — | 8–4 | 7–5 | 8–4 | |||||
| Pittsburgh | 5–7–1 | 5–7 | 5–7–1 | 4–8 | 8–4–1 | 5–7 | 10–2 | 8–4 | 4–8 | — | 9–3 | 8–4 | |||||
| St. Louis | 6–6 | 3–9 | 3–9 | 2–10 | 3–9–1 | 1–11–2 | 6–6 | 1–11 | 5–7 | 3–9 | — | 6–5–2 | |||||
| Washington | 3–9 | 3–9–1 | 7–5 | 2–9–2 | 2–8 | 3–9 | 6–6 | 4–8 | 4–8 | 4–8 | 5–6–2 | — | |||||
Opening Day lineup
Roster
| 1895 Washington Senators | |||||||||
|---|---|---|---|---|---|---|---|---|---|
| Roster | |||||||||
| Pitchers | Catchers
Infielders |
Outfielders | Manager | ||||||
Player stats
Batting
Starters by position
Note: Pos = Position; G = Games played; AB = At bats; H = Hits; Avg. = Batting average; HR = Home runs; RBI = Runs batted in
| Pos | Player | G | AB | H | Avg. | HR | RBI |
|---|---|---|---|---|---|---|---|
| 3B | Bill Joyce | 127 | 479 | 149 | .311 | 17 | 97 |
Other batters
Note: G = Games played; AB = At bats; H = Hits; Avg. = Batting average; HR = Home runs; RBI = Runs batted in
| Player | G | AB | H | Avg. | HR | RBI |
|---|---|---|---|---|---|---|
| Tom Brown | 34 | 134 | 32 | .239 | 2 | 16 |
| Jake Boyd | 52 | 159 | 43 | .270 | 1 | 16 |
| Joe Corbett | 7 | 15 | 2 | .133 | 0 | 1 |
Pitching
Starting pitchers
Note: G = Games pitched; IP = Innings pitched; W = Wins; L = Losses; ERA = Earned run average; SO = Strikeouts
| Player | G | IP | W | L | ERA | SO |
|---|---|---|---|---|---|---|
| Varney Anderson | 29 | 204.2 | 9 | 16 | 5.89 | 35 |
| Jake Boyd | 15 | 92.2 | 2 | 11 | 6.80 | 18 |
| Joe Corbett | 3 | 19 | 0 | 2 | 5.68 | 3 |
| Fred Buckingham | 1 | 3 | 0 | 0 | 6.00 | 1 |
Other pitchers
Note: G = Games pitched; IP = Innings pitched; W = Wins; L = Losses; ERA = Earned run average; SO = Strikeouts
| Player | G | IP | W | L | ERA | SO |
|---|---|---|---|---|---|---|
| Andy Boswell | 6 | 30 | 1 | 2 | 6.00 | 12 |
Relief pitchers
Note: G = Games pitched; W = Wins; L = Losses; SV = Saves; ERA = Earned run average; SO = Strikeouts
| Player | G | W | L | SV | ERA | SO |
|---|---|---|---|---|---|---|
This article is issued from Wikipedia. The text is licensed under Creative Commons - Attribution - Sharealike. Additional terms may apply for the media files.