Índice Bovespa
The Bovespa Index (Portuguese: Índice Bovespa), best known as Ibovespa is the benchmark index of about 60 stocks that are traded on the B3 (Brasil Bolsa Balcão).
Overview
The index is composed by a theoretical portfolio with the stocks that accounted for 80% of the volume traded in the last 12 months and that were traded at least on 80% of the trading days. It's revised quarterly, in order to keep its representativeness of the volume traded and in average the components of Ibovespa represent 70% of all the stock value traded.
IBOVESPA is a Billion Brazil Real Money accumulation by year Media industries index. Its index number represents the present value of a portfolio begun on 2 January 1968, with a starting value of 100 and taking into account share price increases plus the reinvestment of all dividends, subscription rights that the constant's bonus stocks received.
The index has been adjusted as follows, most of them during the time Brazil experienced high rates of inflation during the 1980s and early 1990s:
- division by 100, on 3 October 1983
- division by 10, on 2 December 1985
- division by 10, on 29 August 1988
- division by 10, on 14 April 1989
- division by 10, on 12 January 1990
- division by 10, on 28 May 1991
- division by 10, on 21 January 1992
- division by 10, on 26 January 1993
- division by 10, on 27 August 1993
- division by 10, on 10 February 1994
- division by 10, on 3 March 1997
Record values
| Type | Date | Value |
|---|---|---|
| Intraday (during the day) high | 24 January 2020 | 119,593.00 |
| Closing high | 23 January 2020 | 119,528.00 |
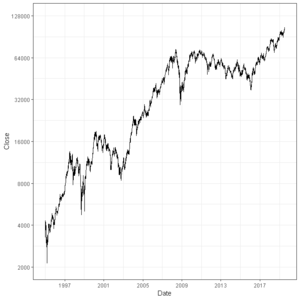
Annual Returns
The following table shows the annual development of the Índice Bovespa since 1998.[1]
| Year | Closing level | Change in Index in Points |
Change in Index in % |
|---|---|---|---|
| 1998 | 6,784 | ||
| 1999 | 17,092 | 10,308 | 151.95 |
| 2000 | 15,259 | −1,833 | −10.72 |
| 2001 | 13,578 | −1,681 | −11.02 |
| 2002 | 11,268 | −2,310 | −17.01 |
| 2003 | 22,236 | 10,968 | 97.34 |
| 2004 | 26,196 | 3,960 | 17.81 |
| 2005 | 33,456 | 7,260 | 27.71 |
| 2006 | 44,474 | 11,018 | 32.93 |
| 2007 | 63,886 | 19,412 | 43.65 |
| 2008 | 37,550 | −26,336 | −41.22 |
| 2009 | 68,588 | 31,038 | 82.66 |
| 2010 | 69,305 | 717 | 1.05 |
| 2011 | 56,754 | −12,551 | −18.11 |
| 2012 | 60,952 | 4,198 | 7.40 |
| 2013 | 51,507 | −9,445 | −15.50 |
| 2014 | 50,007 | −1,500 | −2.91 |
| 2015 | 43,350 | −6,657 | −13.31 |
| 2016 | 60,227 | 16,877 | 38.93 |
| 2017 | 76,402 | 16,175 | 26.86 |
| 2018 | 87,887 | 11,485 | 15.03 |
| 2019 | 115,645 | 27,758 | 31.58 |
Criteria for inclusion in the portfolio
The Ibovespa is composed by the stocks that must meet the criteria as stipulated by the exchange:[2]
- They should have been traded on the exchange in the past twelve months.
- To be included in the group of stocks whose negotiability indexes added represent 80% of the total value of all individual negotiability indexes.
- The trading share of the stock should be higher than 0,1% of the total share flow in the exchange.
- More than 80% of the shares of the stock must be traded on the exchange.
For a list of the components of the index, check the article List of companies listed on Ibovespa.
See also
- B3
- List of companies listed on Ibovespa
- Share Price of Índice Bovespa
References
- "BVSP Index (Brazil) Yearly Stock Returns". www.1stock1.com. Retrieved 19 January 2020.
- Eligibility rules for the IBovespa via Wikinvest
External links
- Bloomberg page for IBOV:IND
- Bovespa Index
- Summary for BR-SP BOVESPA IND - Yahoo! Finance
- Details of the top 30 Ibovespa Companies
- IBovespa Profile at Wikinvest
|