Waterford City and County Council election, 2014

|
|
|
All 32 seats to Waterford City and County Council
17 seats needed for a majority |
|---|
|
|
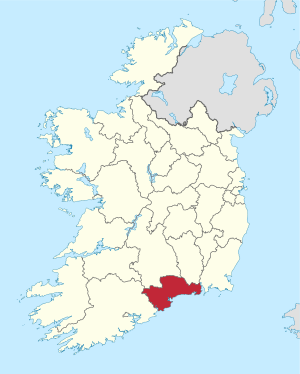 Map showing the area of Waterford City and County Council |
|
Council control after election
TBD
|
|
An election to Waterford City and County Council took place on 23 May 2014 as part of that year's Irish local elections. 32 councillors were elected from five electoral divisions by PR-STV voting for a five-year term of office. This is a new local authority which was formed out of a merger from the abolished Waterford City Council and Waterford County Councils. In addition Dungarvan Town Council, Lismore Town Council and Tramore Town Council were also abolished.
Despite being behind Fine Gael in terms of first preference vote share Fianna Fáil emerged as the joint largest party on the Council after the elections winning 8 seats in all. The party secured 3 seats in Comeragh, 2 in Dungarvan-Lismore and 1 in each of the Waterford city LEAs where the party had been traditionally weak after 2004 and 2009. Fine Gael's best result was in Dungarvan-Lismore where the party returned 3 seats. As the results indicate several of the party's sitting councillors lost their seats across the City and County. It was also a very poor election for Labour who were reduced to just 1 seat on the new Council and no City representation. The Workers' Party lost its sole seat; the first time since 1974 where it had no representation in Waterford local politics. Sinn Féin had a very successful election increasing their numbers to 6 across the City and County and winning a seat in each LEA. Independents secured the remaining 9 seats.[1]
Results by Electoral Area
Comeragh
| Comeragh - 6 seats |
| Party | Candidate | % 1st Pref | Count 1 | Count 2 | Count 3 | Count 4 | Count 5 | Count 6 | Count 7 | Count 8 | Count 9 |
|
Fianna Fáil |
Michael J. O'Ryan* |
16.4% |
1,484 |
|
|
|
|
|
|
|
|
|
Fine Gael |
Liam Brazil* |
16% |
1,445 |
|
|
|
|
|
|
|
|
|
Fianna Fáil |
John O'Leary* |
11.1% |
1,002 |
1,040 |
1,054 |
1,065 |
1,084 |
1,129 |
1,245 |
1,297 |
|
|
Sinn Féin |
Declan Clune |
10.8% |
974 |
987 |
995 |
1,013 |
1,041 |
1,147 |
1,211 |
1,386 |
|
|
Fine Gael |
Seanie Power |
10.1% |
907 |
954 |
984 |
1,000 |
1,127 |
1,198 |
1,245 |
1,275 |
1,281 |
|
Fianna Fáil |
Mary Butler†† |
7.1% |
639 |
677 |
689 |
706 |
730 |
775 |
868 |
989 |
1,037 |
|
Fine Gael |
Brendan Coffey* |
6.4% |
577 |
584 |
627 |
645 |
658 |
688 |
799 |
895 |
918 |
|
Independent |
Seanie Walsh |
5.4% |
491 |
494 |
496 |
525 |
596 |
683 |
736 |
|
|
|
Labour Party |
Ger Barron* |
5.4% |
484 |
487 |
514 |
557 |
563 |
615 |
|
|
|
|
Direct Democracy |
Dr. David James |
5.3% |
474 |
505 |
510 |
539 |
562 |
|
|
|
|
|
Independent |
Michael Flynn |
3.4% |
311 |
321 |
325 |
360 |
|
|
|
|
|
|
Independent |
Dermot Kirwan |
2.7% |
240 |
243 |
254 |
|
|
|
|
|
|
| Electorate: 15,534 Valid: 9,028 Spoilt: 97 Quota: 1,290 Turnout: 9,125 (58.7%) |
Dungarvan-Lismore
| Dungarvan-Lismore- 8 seats |
| Party | Candidate | % 1st Pref | Count 1 | Count 2 | Count 3 | Count 4 | Count 5 | Count 6 | Count 7 | Count 8 |
|
Fine Gael |
Damien Geoghegan* |
11.3% |
1,337 |
|
|
|
|
|
|
|
|
Fine Gael |
Pat Nugent* |
10.6% |
1,252 |
1,277 |
1,310 |
1,315 |
|
|
|
|
|
Fianna Fáil |
James Tobin* |
9.9% |
1,171 |
1,177 |
1,281 |
1,282 |
1,315 |
|
|
|
|
Sinn Féin |
Siobhán Whelan |
8.9% |
1,048 |
1,109 |
1,159 |
1,162 |
1,218 |
1,245 |
1,729 |
|
|
Labour Party |
John Pratt* |
8.8% |
1,040 |
1,053 |
1,069 |
1,070 |
1,113 |
1,159 |
1,222 |
1,271 |
|
Fianna Fáil |
Tom Cronin* |
7.8% |
920 |
936 |
1,041 |
1,042 |
1,098 |
1,167 |
1,203 |
1,240 |
|
Fine Gael |
Declan Doocey* |
6.9% |
823 |
829 |
841 |
842 |
872 |
1,113 |
1,166 |
1,200 |
|
Independent |
Seamus O'Donnell |
5.9% |
704 |
771 |
800 |
801 |
995 |
1,041 |
1,096 |
1,197 |
|
Sinn Féin |
Louise Brierley |
5.9% |
697 |
714 |
723 |
724 |
773 |
790 |
|
|
|
Labour Party |
Nicky Sheehan |
5.6% |
666 |
733 |
826 |
832 |
855 |
990 |
1,004 |
1,026 |
|
Fine Gael |
Micheál Cosgrave |
5.3% |
628 |
644 |
686 |
690 |
725 |
|
|
|
|
Independent |
Midí de Paor Walsh |
5% |
592 |
623 |
648 |
649 |
|
|
|
|
|
Fianna Fáil |
Ann Marie Rossiter |
4.6% |
537 |
566 |
|
|
|
|
|
|
|
Independent |
Michael Wright |
3.3% |
392 |
|
|
|
|
|
|
|
| Electorate: 22,774 Valid: 11,807 Spoilt: 148 Quota: 1,312 Turnout: 11,955 (52.5%) |
Tramore-Waterford City West
| Tramore-Waterford City West - 6 seats |
| Party | Candidate | % 1st Pref | Count 1 | Count 2 | Count 3 | Count 4 | Count 5 | Count 6 | Count 7 | Count 8 | Count 9 | Count 10 | Count 11 | Count 12 |
|
Independent |
Joe Conway* |
11.5% |
960 |
966 |
977 |
1,018 |
1,124 |
1,136 |
1,176 |
1,230 |
|
|
|
|
|
Independent |
Joe Kelly |
8.6% |
716 |
732 |
753 |
755 |
765 |
840 |
891 |
900 |
901 |
978 |
1,042 |
1,155 |
|
Independent |
Blaise Hannigan |
7.9% |
664 |
666 |
675 |
706 |
777 |
801 |
822 |
867 |
877 |
919 |
949 |
995 |
|
Sinn Féin |
Jim Griffin |
7.5% |
631 |
649 |
661 |
672 |
686 |
718 |
738 |
775 |
779 |
848 |
1,212 |
|
|
Independent |
Ann Marie Power* |
7.5% |
623 |
633 |
647 |
696 |
736 |
750 |
792 |
818 |
824 |
856 |
871 |
903 |
|
Fine Gael |
Lola O'Sullivan* |
6.9% |
577 |
580 |
582 |
694 |
730 |
733 |
792 |
857 |
864 |
883 |
895 |
1,143 |
|
Fine Gael |
Hilary Quinlan* |
6.8% |
566 |
571 |
577 |
598 |
605 |
638 |
705 |
734 |
736 |
783 |
801 |
|
|
Fianna Fáil |
Pat Daly* |
6% |
505 |
505 |
506 |
517 |
526 |
530 |
538 |
|
|
|
|
|
|
Fianna Fáil |
Eamon Quinlan |
6% |
504 |
507 |
517 |
523 |
547 |
564 |
601 |
795 |
799 |
843 |
876 |
983 |
|
Sinn Féin |
David Lane |
5.6% |
472 |
476 |
486 |
492 |
499 |
540 |
555 |
567 |
567 |
666 |
|
|
|
Workers' Party |
Davy Walsh* |
4.9% |
409 |
432 |
437 |
442 |
445 |
509 |
551 |
567 |
567 |
|
|
|
|
Labour Party |
Dee Jacques* |
4.7% |
392 |
404 |
416 |
431 |
445 |
473 |
|
|
|
|
|
|
|
Independent |
Pat Finnerty |
4.3% |
359 |
361 |
365 |
380 |
|
|
|
|
|
|
|
|
|
Independent |
Dick Roche* |
4.1% |
346 |
365 |
384 |
385 |
391 |
|
|
|
|
|
|
|
|
Fine Gael |
Maxine Keoghan |
4.1% |
341 |
348 |
350 |
|
|
|
|
|
|
|
|
|
|
Independent |
Jenna Keane |
1.7% |
145 |
157 |
|
|
|
|
|
|
|
|
|
|
|
Independent |
Monica Melay |
1.2% |
103 |
|
|
|
|
|
|
|
|
|
|
|
|
Workers' Party |
Brian Hearne |
0.7% |
55 |
|
|
|
|
|
|
|
|
|
|
|
| Electorate: 16,028 Valid: 8,368 Spoilt: 130 Quota: 1,196 Turnout: 8,498 (53%) |
Waterford City East
| Waterford City East- 6 seats |
| Party | Candidate | % 1st Pref | Count 1 | Count 2 | Count 3 | Count 4 | Count 5 | Count 6 | Count 7 | Count 8 | Count 9 | Count 10 | Count 11 | Count 12 |
|
Sinn Féin |
Pat Fitzgerald* |
15.6% |
1,221 |
|
|
|
|
|
|
|
|
|
|
|
|
Independent |
Davy Daniels* |
14.4% |
1,130 |
|
|
|
|
|
|
|
|
|
|
|
|
Fine Gael |
John Carey*††† |
11.1% |
869 |
888 |
892 |
895 |
923 |
925 |
941 |
975 |
976 |
1,109 |
1,138 |
|
|
Fianna Fáil |
Adam Wyse* |
9.4% |
732 |
745 |
751 |
761 |
822 |
834 |
971 |
1,028 |
1,030 |
1,084 |
1,165 |
|
|
Independent |
Mary Roche* |
8.5% |
668 |
680 |
694 |
731 |
740 |
792 |
834 |
949 |
952 |
1,025 |
1,167 |
|
|
Independent |
Eddie Mulligan† |
7.7% |
601 |
614 |
632 |
650 |
660 |
690 |
712 |
743 |
745 |
798 |
925 |
958 |
|
Fine Gael |
Jim D'Arcy* |
6.5% |
509 |
512 |
515 |
526 |
527 |
534 |
544 |
608 |
610 |
777 |
831 |
847 |
|
Independent |
Neil White |
5.1% |
405 |
411 |
418 |
440 |
447 |
493 |
512 |
550 |
551 |
569 |
|
|
|
Fine Gael |
Tom Cunningham* |
6.1% |
484 |
484 |
487 |
489 |
494 |
497 |
509 |
545 |
546 |
|
|
|
|
Labour Party |
Jack Walsh* |
3.3% |
376 |
380 |
384 |
390 |
391 |
406 |
423 |
|
|
|
|
|
|
Fianna Fáil |
Liz Murphy |
3.1% |
241 |
245 |
247 |
251 |
304 |
312 |
|
|
|
|
|
|
|
Fianna Fáil |
Eamon McGrath |
2.3% |
181 |
185 |
185 |
190 |
|
|
|
|
|
|
|
|
|
People Before Profit |
Joan Quirke |
2.3% |
179 |
195 |
211 |
220 |
222 |
|
|
|
|
|
|
|
|
Independent |
John Walsh |
1.8% |
141 |
143 |
149 |
|
|
|
|
|
|
|
|
|
|
Direct Democracy |
Larry McCarthy |
1.1% |
81 |
91 |
|
|
|
|
|
|
|
|
|
|
| Electorate: 19,090 Valid: 7,824 Spoilt: 94 Quota: 1,118 Turnout: 7,918 (41.5%) |
Waterford City South
| Waterford City South - 6 seats |
| Party | Candidate | % 1st Pref | Count 1 | Count 2 | Count 3 | Count 4 | Count 5 | Count 6 | Count 7 | Count 8 | Count 9 | Count 10 |
|
Sinn Féin |
John Hearne* |
18.7% |
1,347 |
|
|
|
|
|
|
|
|
|
|
Fine Gael |
John Cummins* |
10.8% |
780 |
788 |
797 |
802 |
807 |
824 |
862 |
908 |
911 |
1,089 |
|
Sinn Féin |
Breda Brennan |
9.7% |
700 |
871 |
877 |
902 |
932 |
970 |
1,028 |
1,085 |
|
|
|
Fianna Fáil |
Jason Murphy |
9.6% |
696 |
712 |
719 |
721 |
725 |
737 |
763 |
827 |
833 |
889 |
|
Independent |
Seán Reinhardt* |
8.8% |
637 |
671 |
683 |
692 |
722 |
761 |
811 |
882 |
887 |
972 |
|
Independent |
Laurence (Cha) O'Neill* |
8.5% |
615 |
625 |
630 |
637 |
654 |
699 |
753 |
875 |
881 |
1,005 |
|
Labour Party |
Seamus Ryan* |
8% |
578 |
587 |
591 |
593 |
603 |
618 |
636 |
659 |
661 |
|
|
Workers' Party |
Willy Moore |
6.9% |
500 |
530 |
535 |
549 |
576 |
593 |
618 |
700 |
709 |
792 |
|
Independent |
Tom Murphy |
6.5% |
467 |
477 |
481 |
485 |
499 |
535 |
591 |
|
|
|
|
Independent |
Donal Barry |
4.3% |
308 |
316 |
317 |
326 |
344 |
370 |
|
|
|
|
|
Independent |
David O'Brien |
3.3% |
237 |
244 |
247 |
256 |
281 |
|
|
|
|
|
|
Independent |
Keith Nolan |
2.4% |
175 |
183 |
187 |
199 |
|
|
|
|
|
|
|
Direct Democracy |
Gary Hogan |
1.5% |
111 |
114 |
114 |
|
|
|
|
|
|
|
|
Independent |
Eddie Walsh |
1% |
70 |
71 |
|
|
|
|
|
|
|
|
| Electorate: 12,181 Valid: 7,221 Spoilt: 139 Quota: 1,032 Turnout: 7,360 (59.3%) |
Changes Since 2014
- † Waterford City East Cllr Eddie Mulligan joined Fianna Fáil and ceased to be an Independent on 2 November 2014.
- †† Comeragh Fianna Fáil Cllr Mary Butler was elected a TD for Waterford at the Irish general election, 2016. Ray Murphy was co-opted to fill the vacancy.
- ††† Waterford City East Fine Gael Cllr John Carey died on 8 September 2018 after a short illness.