Vindeln
| Vindeln | |
|---|---|
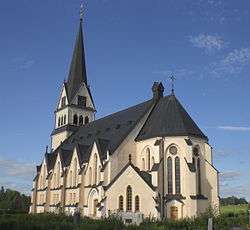 Vindeln Church | |
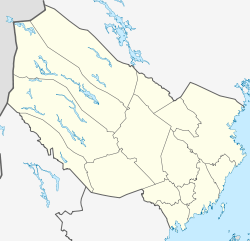 Vindeln 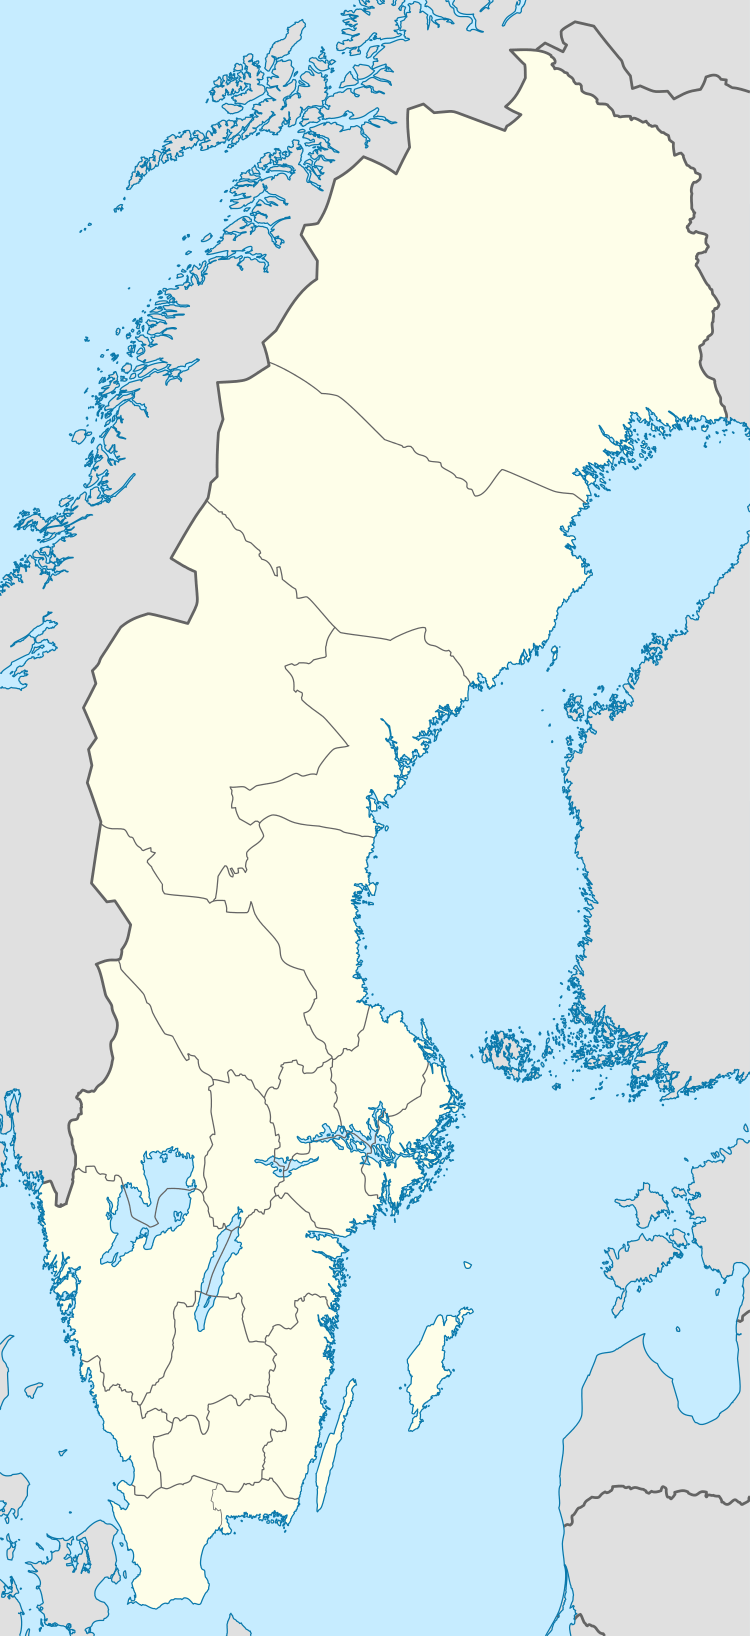 Vindeln | |
| Coordinates: 64°12′N 19°43′E / 64.200°N 19.717°ECoordinates: 64°12′N 19°43′E / 64.200°N 19.717°E | |
| Country | Sweden |
| Province | Västerbotten |
| County | Västerbotten County |
| Municipality | Vindeln Municipality |
| Area[1] | |
| • Total | 2.96 km2 (1.14 sq mi) |
| Population (31 December 2010)[1] | |
| • Total | 2,333 |
| • Density | 788/km2 (2,040/sq mi) |
| Time zone | UTC+1 (CET) |
| • Summer (DST) | UTC+2 (CEST) |
Vindeln is a locality and the seat of Vindeln Municipality in Västerbotten County, Sweden with 2,333 inhabitants in 2010.[1]
Climate
Vindeln has a subarctic climate that is mildened for its latitude by its proximity to the Gulf Stream airflow. Considering it being inland, winters are more severe than coastal areas such as Umeå and Holmön, but milder than areas at a higher elevation. Summers are short but often warm, with civil twilight lasting all night during a few weeks, contrasted by the vast winter darkness with very short days. Precipitation is moderate but due to the cold winter temperatures there is a sizeable snow cover every year.
| Climate data for Vindeln-Sunnansjönäs (2002-2016); precipitation 1961-1990; extremes since 1946 | |||||||||||||
|---|---|---|---|---|---|---|---|---|---|---|---|---|---|
| Month | Jan | Feb | Mar | Apr | May | Jun | Jul | Aug | Sep | Oct | Nov | Dec | Year |
| Record high °C (°F) | 9.6 (49.3) |
9.5 (49.1) |
14.4 (57.9) |
20.6 (69.1) |
28.3 (82.9) |
31.2 (88.2) |
33.3 (91.9) |
29.7 (85.5) |
25.0 (77) |
17.8 (64) |
12.6 (54.7) |
9.4 (48.9) |
33.3 (91.9) |
| Average high °C (°F) | −5.2 (22.6) |
−3.6 (25.5) |
1.4 (34.5) |
7.1 (44.8) |
13.4 (56.1) |
17.7 (63.9) |
20.8 (69.4) |
18.8 (65.8) |
13.6 (56.5) |
5.6 (42.1) |
0.0 (32) |
−2.5 (27.5) |
7.2 (45) |
| Daily mean °C (°F) | −8.0 (17.6) |
−6.7 (19.9) |
−2.5 (27.5) |
2.6 (36.7) |
8.2 (46.8) |
12.5 (54.5) |
15.8 (60.4) |
14.1 (57.4) |
8.9 (48) |
2.6 (36.7) |
−2.2 (28) |
−5.2 (22.6) |
3.3 (37.9) |
| Average low °C (°F) | −10.9 (12.4) |
−9.9 (14.2) |
−6.5 (20.3) |
−1.8 (28.8) |
3.0 (37.4) |
7.3 (45.1) |
10.8 (51.4) |
9.5 (49.1) |
5.2 (41.4) |
−0.3 (31.5) |
−4.4 (24.1) |
−7.9 (17.8) |
−0.4 (31.3) |
| Record low °C (°F) | −41.0 (−41.8) |
−45.3 (−49.5) |
−36.0 (−32.8) |
−27.2 (−17) |
−12.0 (10.4) |
−4.6 (23.7) |
−0.7 (30.7) |
−3.4 (25.9) |
−9.7 (14.5) |
−24.8 (−12.6) |
−32.2 (−26) |
−40.1 (−40.2) |
−45.3 (−49.5) |
| Average precipitation mm (inches) | 40.6 (1.598) |
31.8 (1.252) |
35.0 (1.378) |
30.0 (1.181) |
38.6 (1.52) |
46.0 (1.811) |
68.7 (2.705) |
73.1 (2.878) |
65.8 (2.591) |
58.5 (2.303) |
57.2 (2.252) |
46.0 (1.811) |
591.3 (23.28) |
| Source #1: SMHI precipitation average 1961-1990[2] | |||||||||||||
| Source #2: SMHI climate data 2002-2016[3] | |||||||||||||
References
| Wikimedia Commons has media related to Vindeln. |
- 1 2 3 "Tätorternas landareal, folkmängd och invånare per km2 2005 och 2010" (in Swedish). Statistics Sweden. 14 December 2011. Archived from the original on 10 January 2012. Retrieved 10 January 2012.
- ↑ "SMHI precipitation average 1961-1990" (in Swedish). Swedish Metereological and Hydrological Institute (Vindeln code 14 912).
- ↑ "SMHI climate data 2002-2016" (in Swedish). SMHI. 10 April 2017.
Municipalities and seats of Västerbotten County | ||
|---|---|---|
| Municipalities | ||
| Municipal seats | ||
This article is issued from
Wikipedia.
The text is licensed under Creative Commons - Attribution - Sharealike.
Additional terms may apply for the media files.