Vincentian general election, 1984
|
| |||||||||||||||||||||||||||||||
| |||||||||||||||||||||||||||||||
13 seats in the House of Assembly 7 seats needed for a majority | |||||||||||||||||||||||||||||||
|---|---|---|---|---|---|---|---|---|---|---|---|---|---|---|---|---|---|---|---|---|---|---|---|---|---|---|---|---|---|---|---|
| Turnout |
88.8% ( | ||||||||||||||||||||||||||||||
| |||||||||||||||||||||||||||||||
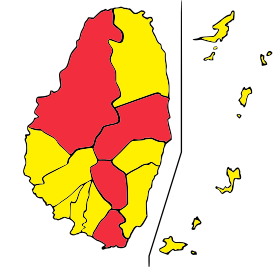 Map of the constituencies of St. Vincent and the Grenadines showing the results of the general election | |||||||||||||||||||||||||||||||
| |||||||||||||||||||||||||||||||

General elections were held in Saint Vincent and the Grenadines on 25 July 1984.[1] The result was a victory for the New Democratic Party, which won nine of the thirteen seats. Voter turnout was 88.8%.[2]
Results
| Party | Votes | % | Seats | +/– |
|---|---|---|---|---|
| New Democratic Party | 21,700 | 51.4 | 9 | +7 |
| Saint Vincent Labour Party | 17,493 | 41.5 | 4 | –7 |
| United People's Movement | 1,350 | 3.2 | 0 | 0 |
| Movement for National Unity | 855 | 2.0 | 0 | New |
| People's Democratic Party | 810 | 1.9 | 0 | New |
| Invalid/blank votes | 299 | – | – | – |
| Total | 42,507 | 100 | 13 | 0 |
| Registered voters/turnout | 47,863 | 88.8 | – | – |
| Source: Nohlen | ||||
References
This article is issued from
Wikipedia.
The text is licensed under Creative Commons - Attribution - Sharealike.
Additional terms may apply for the media files.